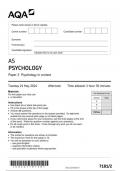
ECON1010 Taking Charge of Your Economic Future Name: Unit 4 Touchstone Template Date: MONTH 1 BUDGET MONTH 2 BUDGET
AmountPercent Amount
Income $4,167100%Income $4,250
Expenditure Expenditure
Housing $83320% Housing $833
Food $62515% Food $500
Transportation $62515% Transportation $550
Education $41710% Education $400
Utilities $2085% Utilities $208
Taxes $2085% Taxes $208
Health Care $3338% Health Care $733
Family Care $2085% Family Care $208
Miscellaneous $2085% Miscellaneous $208
Savings $50012% Savings $400
Total$4,167100% Total$4,250
PART 1: ANALYZING YOUR PERSONAL FINANCES
SCENARIO: Your monthly budget is going through some changes over the next three months. The good news is that your income has increased because of your strong performance at work. However, health care and miscellaneous costs have also gone up. You will need to reallocate your monthly budget based on these changes. The changes are represented by embedded formulas in the MONTHLY BUDGET tables above, located inside the shaded cells.
STEP 1: Enter the previous values you obtained from the Unit 2 Touchstone into the MONTH 1 BUDGET. Important: Before you do, be sure to divide each dollar amount by 12 . Remember, the Unit 2 Touchstone was an annual basis while this Touchstone is a monthly basis. If you no longer have the previous values, create new ones. Remember to start by entering your income and be sure the MONTH 1 BUDGET balances. STEP 2: Now create your MONTH 2 BUDGET and your MONTH 3 BUDGET above. Do not change the predetermined costs for Health Care in the second month or Miscellaneous in the third month. Do not modify the income in either month. Remember that your monthly income must equal your monthly expenditures (including savings). Look ahead to step 3 to see how you can use formulas for proper balancing. STEP 3: Your MONTH 2 BUDGET and your MONTH 3 BUDGET may or may not be balanced. To check, do the following:
• Enter a formula to calculate your total expenditures. Adjust your expenditures until the total equals your monthly income.
• Next, enter formulas in the percent column to calculate each expenditure as a percentage of the total expenditure.
STEP 4: Using the tools in Excel, make a graph for each of the three budgets to show your spending allocation. You may use a pie chart, column chart, bar chart, or some other graph type. Review the tutorial in Unit 1 called Data Visualization if you need a refresher on graphing. If your embedded graphs block your view, move them off the work area, either downward or to the right. STEP 5: Fill in the table for SAVINGS PROGRESS located at the top right of this spreadsheet:
• Enter your monthly savings from steps 1-4. The cumulative savings column will calculate automatically.
• Recall your total savings goal from the Unit 2 Touchstone. In the last column, record how much more money you need to save in order to reach your goal.
• If you can't recall your savings goal, create a new one so you're able to complete the table.
STEP 6: Using the tools in Excel, make a graph that shows your incremental progress toward your savings goal based on the data in the SAVINGS PROGRESS table:
• Select a graph type that best illustrates your progress. Move the graph off the work area if it obstructs your view.
• Finally, using steps 1-6 as a reference, complete the REFLECTION QUESTIONS on the right side of this spreadsheet.
Sophia Learning, LLC. Copyright © 2021. All rights reserved.
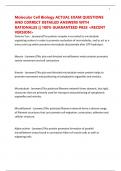
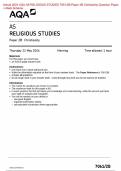
Month 1
HousingFoodTransportationEducationUtilities
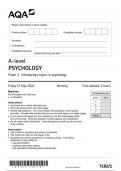
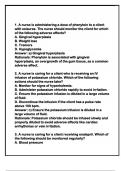
TaxesHealth CareFamily CareMiscellaneousSavingsMonth 2
HousingFoodTransportationEducationUtilities
TaxesHealth CareFamily CareMiscellaneousSavings
AmountPercent Amount
Income $4,167100%Income $4,250
Expenditure Expenditure
Housing $83320% Housing $833
Food $62515% Food $500
Transportation $62515% Transportation $550
Education $41710% Education $400
Utilities $2085% Utilities $208
Taxes $2085% Taxes $208
Health Care $3338% Health Care $733
Family Care $2085% Family Care $208
Miscellaneous $2085% Miscellaneous $208
Savings $50012% Savings $400
Total$4,167100% Total$4,250
PART 1: ANALYZING YOUR PERSONAL FINANCES
SCENARIO: Your monthly budget is going through some changes over the next three months. The good news is that your income has increased because of your strong performance at work. However, health care and miscellaneous costs have also gone up. You will need to reallocate your monthly budget based on these changes. The changes are represented by embedded formulas in the MONTHLY BUDGET tables above, located inside the shaded cells.
STEP 1: Enter the previous values you obtained from the Unit 2 Touchstone into the MONTH 1 BUDGET. Important: Before you do, be sure to divide each dollar amount by 12 . Remember, the Unit 2 Touchstone was an annual basis while this Touchstone is a monthly basis. If you no longer have the previous values, create new ones. Remember to start by entering your income and be sure the MONTH 1 BUDGET balances. STEP 2: Now create your MONTH 2 BUDGET and your MONTH 3 BUDGET above. Do not change the predetermined costs for Health Care in the second month or Miscellaneous in the third month. Do not modify the income in either month. Remember that your monthly income must equal your monthly expenditures (including savings). Look ahead to step 3 to see how you can use formulas for proper balancing. STEP 3: Your MONTH 2 BUDGET and your MONTH 3 BUDGET may or may not be balanced. To check, do the following:
• Enter a formula to calculate your total expenditures. Adjust your expenditures until the total equals your monthly income.
• Next, enter formulas in the percent column to calculate each expenditure as a percentage of the total expenditure.
STEP 4: Using the tools in Excel, make a graph for each of the three budgets to show your spending allocation. You may use a pie chart, column chart, bar chart, or some other graph type. Review the tutorial in Unit 1 called Data Visualization if you need a refresher on graphing. If your embedded graphs block your view, move them off the work area, either downward or to the right. STEP 5: Fill in the table for SAVINGS PROGRESS located at the top right of this spreadsheet:
• Enter your monthly savings from steps 1-4. The cumulative savings column will calculate automatically.
• Recall your total savings goal from the Unit 2 Touchstone. In the last column, record how much more money you need to save in order to reach your goal.
• If you can't recall your savings goal, create a new one so you're able to complete the table.
STEP 6: Using the tools in Excel, make a graph that shows your incremental progress toward your savings goal based on the data in the SAVINGS PROGRESS table:
• Select a graph type that best illustrates your progress. Move the graph off the work area if it obstructs your view.
• Finally, using steps 1-6 as a reference, complete the REFLECTION QUESTIONS on the right side of this spreadsheet.
Sophia Learning, LLC. Copyright © 2021. All rights reserved.
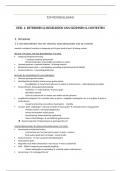
Month 1
HousingFoodTransportationEducationUtilities
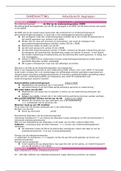
TaxesHealth CareFamily CareMiscellaneousSavingsMonth 2
HousingFoodTransportationEducationUtilities
TaxesHealth CareFamily CareMiscellaneousSavings