Modelling Airfares of the Australian Domestic
Flight: Melbourne to Sydney
Image 1 – Airplane View (Aviation World, 2020)
,Introduction
My intrigue towards airplane ticket prices began amidst a
time of boredom during the summer holidays when Australia
was under lockdown due to the COVID-19 crisis. As an
international student in boarding school, I had not seen my
friends and family outside of Melbourne for a year now. Out
of my frustration of being homesick, I searched for airplane
tickets to Sydney to visit some family friends. To my
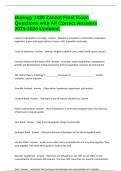
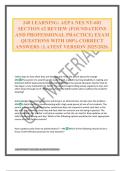
Image 2 – Travel demand during the
surprise, Australian domestic airplane ticket prices have
COVID-19 (McCarthy, 2020)
reduced slightly compared to what I had seen before the
pandemic, despite multiple statistics demonstrating that the airline industry faced a dramatic drop in
demand (McCarthy, 2020). I gradually gained curiosity about airplane ticket price patterns and factors
that potentially impact airfare setting throughout the years.
Over the time I studied abroad, I developed the skill of booking plane tickets at a young age due to my
parents’ inability to understand English. A challenge I often encountered was finding the best time of
day and day of the year to order a plane ticket. I never understood why prices fluctuated and appeared
like entirely random values. To enrich my understanding of the airline industry, I dedicated my math
exploration to observe if airfare fluctuations could be modelled using math functions. In this way, I can
extend my IB mathematical knowledge to the real world. My exploration aims to investigate “which
mathematical models can best represent the change in airfares over time?” and “what external factors
may influence domestic Australian airfares?”
Data Collection
I analysed data from the Bureau of Infrastructure and Transport Research Economics website (BITRE,
2021). The website recorded the cheapest domestic Australian airfares after January 2010. Using a
government website was necessary, as the data provided would be at a highly detailed and accurate
level to begin modelling Melbourne to Sydney airfares.
Table 1 – 2011 BITRE
Airfares
I synthesized the raw data from BITRE to record the airfares in
Year Month $Real
January, April, July, October, and December, as I have school
2011 1 103
holidays and would most likely travel during these months. Table 1
2011 4 100
shows a snapshot of the raw data I had observed, detailing the
2011 7 173
cheapest available return fares from 2011. See Appendix 1 for full
2011 10 117
raw data tables of all years between 2010 – 2020.
2011 12 292
1
,Defining Variables
I decided that the best way to represent airfare fluctuations was to model the prices based on months
mathematically. In this way, I can perform a critical analysis of Australia’s economic state at certain
months in the past decade to observe specific periods of growth and decline. To graph airfares by
months, I converted relevant raw data into coordinate points that indicated price and month of the year.
𝑡 = 𝑡𝑖𝑚𝑒 𝑒𝑥𝑝𝑟𝑒𝑠𝑠𝑒𝑑 𝑖𝑛 𝑦𝑒𝑎𝑟𝑠 𝑎𝑓𝑡𝑒𝑟 2010
𝑃 = 𝑝𝑟𝑖𝑐𝑒 𝑒𝑥𝑝𝑟𝑒𝑠𝑠𝑒𝑑 𝑖𝑛 𝑐ℎ𝑒𝑎𝑝𝑒𝑠𝑡 𝑎𝑖𝑟𝑓𝑎𝑟𝑒 𝑜𝑓 𝑎 𝑝𝑎𝑟𝑡𝑖𝑐𝑢𝑙𝑎𝑟 𝑚𝑜𝑛𝑡ℎ
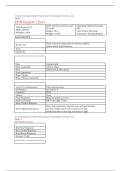
Based on the variables above, the horizontal axis is defined as 𝑡, and the vertical axis is 𝑃. To generate
a coordinate for January 2011, I used the first row of data from Table 1 to decide 𝑡 = 1 (because 2011
is one year after 2010) and 𝑃 = $103. The January 2011 coordinate is visualised in Graph 1.
∴ 𝑃(1) = 103 for January 2011, or (1,103)
Hence, I have decided that the domain of all mathematical models
would be: {𝑡|0 ≤ 𝑡 ≤ 10}
Where 𝑡(0) indicates 2010 and 𝑡(10) = 2020, representing the
specific decade of airfares which I will model for each month.
Using parameters 𝑃 and 𝑡 to operationalise variables, I created a data
table presenting coordinates of airfares each month of a year
(Appendix 2). To better visualise the pattern of airfares, I made
scatterplots to visualise possible patterns in the data (Appendix 3) and
display the domain graphically. A snapshot of Appendix 3 for the Graph 1 – Scatterplot of
January airfares is shown in Graph 1. January points (Snapshot)
Considering a Cyclical Trend for Airplane Ticket Price
My initial attempt at modelling Melbourne to Sydney airplane ticket prices was to examine how closely
the nature of airfare fluctuations align to a sine or cosine graph, or by definition, a sinusoidal function.
I used October’s scatterplot initially, as I thought the coordinates appeared the most cyclical over the
years. Using technology (Desmos, 2021), I applied a sine function to the October scatterplot graph
in Appendix 3 as the 2010 coordinate had the lowest airfare, and then prices gradually increased.
2
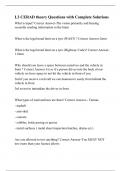
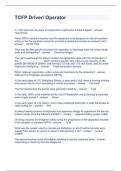
, The regression model visualised in Graph 2
𝑃(𝑡) = 41.573 sin(0.272𝑡 − 1.869) + 146.563 displays a moderate to weak fit to the October
data points; however, the general increase in
airfares is modelled. I can understand how the
sine function can represent the economic growth
over the past decade; how economic factors like
increased GDP may influence the demand and
increase airfares. This weak association
suggests I should segment data points to
examine the patterns of airfares more precisely,
0 which requires piecewise functions. I plan to
manually create this function, allowing a
Graph 2 – Sine function for October Airfares
thorough analysis of airfare patterns.
from 2010 – 2020
Mathematical Processes of Forming a Piecewise Function
Deciding Appropriate Functions within a Piecewise Function
The first step to forming a piecewise function for airfares is to examine the plotted data points
(Appendix 3) of a particular month closely. I began to group specific coordinates of the January
scatterplot based on my mathematical knowledge of functions I learned in the IB course. Each group of
coordinates eventually becomes a sub-function for the piecewise graph for January airfares. Table 2
below explains how I decided on an appropriate function for each group of coordinates and shows
scatterplots that helped me visualise the sub-functions and assisted my reasoning. I used the same
techniques as Table 2 for all the other months.
Table 2 – Snapshots of four January Airfare sub-functions explained
Domain Function The reasoning for each chosen function
𝟎≤𝒕≤𝟐 Logarithmic The trend of this sub-function appears
logarithmic, as the ticket price increases
rapidly then plateau slightly between the
second and third data point. Further, there are
0 no distinct turning points, meaning that data
generally follows a positive, increasing trendline. The graph
intercepts the 𝑃-axis at (0,69), indicating there should be a
horizontal shift of 1 to the left.
3
Flight: Melbourne to Sydney
Image 1 – Airplane View (Aviation World, 2020)
,Introduction
My intrigue towards airplane ticket prices began amidst a
time of boredom during the summer holidays when Australia
was under lockdown due to the COVID-19 crisis. As an
international student in boarding school, I had not seen my
friends and family outside of Melbourne for a year now. Out
of my frustration of being homesick, I searched for airplane
tickets to Sydney to visit some family friends. To my
Image 2 – Travel demand during the
surprise, Australian domestic airplane ticket prices have
COVID-19 (McCarthy, 2020)
reduced slightly compared to what I had seen before the
pandemic, despite multiple statistics demonstrating that the airline industry faced a dramatic drop in
demand (McCarthy, 2020). I gradually gained curiosity about airplane ticket price patterns and factors
that potentially impact airfare setting throughout the years.
Over the time I studied abroad, I developed the skill of booking plane tickets at a young age due to my
parents’ inability to understand English. A challenge I often encountered was finding the best time of
day and day of the year to order a plane ticket. I never understood why prices fluctuated and appeared
like entirely random values. To enrich my understanding of the airline industry, I dedicated my math
exploration to observe if airfare fluctuations could be modelled using math functions. In this way, I can
extend my IB mathematical knowledge to the real world. My exploration aims to investigate “which
mathematical models can best represent the change in airfares over time?” and “what external factors
may influence domestic Australian airfares?”
Data Collection
I analysed data from the Bureau of Infrastructure and Transport Research Economics website (BITRE,
2021). The website recorded the cheapest domestic Australian airfares after January 2010. Using a
government website was necessary, as the data provided would be at a highly detailed and accurate
level to begin modelling Melbourne to Sydney airfares.
Table 1 – 2011 BITRE
Airfares
I synthesized the raw data from BITRE to record the airfares in
Year Month $Real
January, April, July, October, and December, as I have school
2011 1 103
holidays and would most likely travel during these months. Table 1
2011 4 100
shows a snapshot of the raw data I had observed, detailing the
2011 7 173
cheapest available return fares from 2011. See Appendix 1 for full
2011 10 117
raw data tables of all years between 2010 – 2020.
2011 12 292
1
,Defining Variables
I decided that the best way to represent airfare fluctuations was to model the prices based on months
mathematically. In this way, I can perform a critical analysis of Australia’s economic state at certain
months in the past decade to observe specific periods of growth and decline. To graph airfares by
months, I converted relevant raw data into coordinate points that indicated price and month of the year.
𝑡 = 𝑡𝑖𝑚𝑒 𝑒𝑥𝑝𝑟𝑒𝑠𝑠𝑒𝑑 𝑖𝑛 𝑦𝑒𝑎𝑟𝑠 𝑎𝑓𝑡𝑒𝑟 2010
𝑃 = 𝑝𝑟𝑖𝑐𝑒 𝑒𝑥𝑝𝑟𝑒𝑠𝑠𝑒𝑑 𝑖𝑛 𝑐ℎ𝑒𝑎𝑝𝑒𝑠𝑡 𝑎𝑖𝑟𝑓𝑎𝑟𝑒 𝑜𝑓 𝑎 𝑝𝑎𝑟𝑡𝑖𝑐𝑢𝑙𝑎𝑟 𝑚𝑜𝑛𝑡ℎ
Based on the variables above, the horizontal axis is defined as 𝑡, and the vertical axis is 𝑃. To generate
a coordinate for January 2011, I used the first row of data from Table 1 to decide 𝑡 = 1 (because 2011
is one year after 2010) and 𝑃 = $103. The January 2011 coordinate is visualised in Graph 1.
∴ 𝑃(1) = 103 for January 2011, or (1,103)
Hence, I have decided that the domain of all mathematical models
would be: {𝑡|0 ≤ 𝑡 ≤ 10}
Where 𝑡(0) indicates 2010 and 𝑡(10) = 2020, representing the
specific decade of airfares which I will model for each month.
Using parameters 𝑃 and 𝑡 to operationalise variables, I created a data
table presenting coordinates of airfares each month of a year
(Appendix 2). To better visualise the pattern of airfares, I made
scatterplots to visualise possible patterns in the data (Appendix 3) and
display the domain graphically. A snapshot of Appendix 3 for the Graph 1 – Scatterplot of
January airfares is shown in Graph 1. January points (Snapshot)
Considering a Cyclical Trend for Airplane Ticket Price
My initial attempt at modelling Melbourne to Sydney airplane ticket prices was to examine how closely
the nature of airfare fluctuations align to a sine or cosine graph, or by definition, a sinusoidal function.
I used October’s scatterplot initially, as I thought the coordinates appeared the most cyclical over the
years. Using technology (Desmos, 2021), I applied a sine function to the October scatterplot graph
in Appendix 3 as the 2010 coordinate had the lowest airfare, and then prices gradually increased.
2
, The regression model visualised in Graph 2
𝑃(𝑡) = 41.573 sin(0.272𝑡 − 1.869) + 146.563 displays a moderate to weak fit to the October
data points; however, the general increase in
airfares is modelled. I can understand how the
sine function can represent the economic growth
over the past decade; how economic factors like
increased GDP may influence the demand and
increase airfares. This weak association
suggests I should segment data points to
examine the patterns of airfares more precisely,
0 which requires piecewise functions. I plan to
manually create this function, allowing a
Graph 2 – Sine function for October Airfares
thorough analysis of airfare patterns.
from 2010 – 2020
Mathematical Processes of Forming a Piecewise Function
Deciding Appropriate Functions within a Piecewise Function
The first step to forming a piecewise function for airfares is to examine the plotted data points
(Appendix 3) of a particular month closely. I began to group specific coordinates of the January
scatterplot based on my mathematical knowledge of functions I learned in the IB course. Each group of
coordinates eventually becomes a sub-function for the piecewise graph for January airfares. Table 2
below explains how I decided on an appropriate function for each group of coordinates and shows
scatterplots that helped me visualise the sub-functions and assisted my reasoning. I used the same
techniques as Table 2 for all the other months.
Table 2 – Snapshots of four January Airfare sub-functions explained
Domain Function The reasoning for each chosen function
𝟎≤𝒕≤𝟐 Logarithmic The trend of this sub-function appears
logarithmic, as the ticket price increases
rapidly then plateau slightly between the
second and third data point. Further, there are
0 no distinct turning points, meaning that data
generally follows a positive, increasing trendline. The graph
intercepts the 𝑃-axis at (0,69), indicating there should be a
horizontal shift of 1 to the left.
3