Biostatistics
Lecture 0
Doing research:
1. Ask questions
in short antibiotic treatment (3x24h) as good as extended antibiotic treatment (9x24h) of iatrogenic neutropenia
with fever of unknown origin in haematological patients?
2. Formulate hypothesis
Percentage of patients with fever-recurrence within 28 days does not differ between short and extended
antibiotic treatment.
3. Collect data
Randomize 200 patients to receive either short or extended antibiotic treatment and count the number of
patients in each groups with fever-recurrence within 28 days.
a. Cross-sectional: data collected at one point in time.
b. Prospectively: subjects included ‘at baseline’, outcome assessed in future/over time.
i. RCT
ii. Longitudinal/observational study
c. Retrospectively: outcome has been assessed, looking back in time.
4. Analyse data
12 patients receiving short and 9 patient receiving extended antibiotic treatment had fever-recurrence within 28
days; the 95% confidence interval for the difference of -3% is equal to (-11.5%; 5.5%).
a. Binary data: gender, HPV status (infected/not infected), myocardial infarction
(yes/no).
b. Categorical data: alcohol consumption (none/moderate/heavy), clinical T-stage
(1/2/3/4), water source (river/pond/spring).
c. Continuous data: cholesterol, triglyceride concentration, quality of life.
d. Time-to-event data (survival): time-to-dead, time to recurrence after treatment, time
to get employed.
5. Formulate answer
No statistical evidence for benefit of extended antibiotic treatment.
Statistics:
- Descriptive: summarize and describe features of the data.
o Graphics: histogram, boxplot, scatter plot ect.
o Numerical summary measures: mean/average, median (middle number in a rank),
standard deviation, percentage.
- Inferential: draw a conclusion beyond your data sample.
o Estimation: effect size.
o Uncertainty: confidence interval.
o Hypothesis testing: p-value.
Common practice in medical articles:
- For symmetric distributions report
mean and standard deviation (SD).
- For skewed distributions report
median and interquartile range
(IQR).
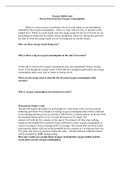
, Normal distribution:
Normally when your mean is 0 and your SD
is 1 the middle 95% of the distribution will
range from -1.96 to +1.96.
Boxplot:
- Maximum
- Q3 (75th percentile)
- Median
- Q1 (first 25%/25th percentile)
- Minimum
- IQR = Q3-Q1
Scatter plot Pearson correlation:
- r = +1 perfectly positive linear association.
- r = 0 no linear association.
- r = -1 perfectly negative linear association.
Example confidence interval for mean: “What is the mean FEV1 in a population of children aged 7-10
year?”. For these 636 children, mean is 1.59. But a different sample of 636 children would result in
different mean FEV1L!
SD 0.30
1. Uncertainty quantified by standard error (SE): SEmean= = =0.012
√n √ 636
2. 95% CI:
( mean−1.96∗SEmean ; mean+ 1.96∗SEmean ) =mean± 1.96∗SEmean=1.59 ±1.96 %∗0.012=[1.57 ; 1
Example CI for proportion: “What proportion of children in a population of children aged 7-10 years
have an FEV1 <1.5L?”.
1. Uncertainty quantified by SE: SEp=
√ p∗(1− p) = √ 0.373∗0.627 =0.019
√n √636
2. 95% CI: p ±1.96∗SEp
95% CI: 0.373 ± 1.96∗0.019=[0.336 ; 0.410]
, Diagnostic testing:
- Sensitivity = P(case is correctly identified as positive) = positive cases/number of cases =
127/130 ~ 97.7%.
- Specificity = P(control is correctly identified as negative) = negative controls/number of
controls – 848/870 ~ 97.5%.
- Positive predicted value (PPV) = positive cases/number of positives = 127/149 = 85.2%.
- Negative predicted value (NPV) = negative controls/number of negatives = 848/851 = 99.6%.
- Prevalence = % cases in the population.
- CI for proportion p = 95% CI: p±1.96*SEp
o SEp =
√ p∗(1− p)
√n
o CI for PPV =
√ p∗(1− p) = √ 0.852∗0.148 =0.029
√n √ 149
95% CI: 0.852 ± 1.96*0.029 = [0.795; 0.909]
Important in SPSS:
- Command can be run directly by clicking OK, but it is recommended to first click of Past to
paste your commands into a syntax which can be saved.
- Go to the syntax editor, select all the lines of code you want to run, and press Run Selection.
- SPSS manual on Canvas.
Lecture 1: Hypothesis QQ plot: only to look at and see if it’s okay.
testing Normal distribution is always a straight line.
You plot the quantiles of your distribution against the quantiles of a normal
distribution.
Normal distribution of your data > all dots should be aligned on a linear line,
but this will not be perfect/might be small deviations.
When the data is not in line at the bottom part, the data is skewed to the
left. And when this happens at the top part the data will be skewed to the
right. But there is no clear border to say when the data is normal or not.
Divide your data into a decided number of quantiles > smaller lines at the
middle because there is more data there.
Depending on you parameters the straight line may differ.
Hypothesis testing: Does mean FEV1 differ between boys and girls? Outcomes can be a difference or
no difference. Fitting hypothesis can be:
- H0: mean FEV1 girls = mean FEV1 boys.
- Ha: mean FEV1 girls ≠ mean FEV1 boys.
Calculate the mean difference: mean boys – mean girls = 1.66 – 1.54 = 0.12 (= effect size).
Two possible solutions could be:
o Reject H0 and accept Ha.
o Do not reject H0.
o Two errors are:
Type 1 = α
Type 2 = β
Lecture 0
Doing research:
1. Ask questions
in short antibiotic treatment (3x24h) as good as extended antibiotic treatment (9x24h) of iatrogenic neutropenia
with fever of unknown origin in haematological patients?
2. Formulate hypothesis
Percentage of patients with fever-recurrence within 28 days does not differ between short and extended
antibiotic treatment.
3. Collect data
Randomize 200 patients to receive either short or extended antibiotic treatment and count the number of
patients in each groups with fever-recurrence within 28 days.
a. Cross-sectional: data collected at one point in time.
b. Prospectively: subjects included ‘at baseline’, outcome assessed in future/over time.
i. RCT
ii. Longitudinal/observational study
c. Retrospectively: outcome has been assessed, looking back in time.
4. Analyse data
12 patients receiving short and 9 patient receiving extended antibiotic treatment had fever-recurrence within 28
days; the 95% confidence interval for the difference of -3% is equal to (-11.5%; 5.5%).
a. Binary data: gender, HPV status (infected/not infected), myocardial infarction
(yes/no).
b. Categorical data: alcohol consumption (none/moderate/heavy), clinical T-stage
(1/2/3/4), water source (river/pond/spring).
c. Continuous data: cholesterol, triglyceride concentration, quality of life.
d. Time-to-event data (survival): time-to-dead, time to recurrence after treatment, time
to get employed.
5. Formulate answer
No statistical evidence for benefit of extended antibiotic treatment.
Statistics:
- Descriptive: summarize and describe features of the data.
o Graphics: histogram, boxplot, scatter plot ect.
o Numerical summary measures: mean/average, median (middle number in a rank),
standard deviation, percentage.
- Inferential: draw a conclusion beyond your data sample.
o Estimation: effect size.
o Uncertainty: confidence interval.
o Hypothesis testing: p-value.
Common practice in medical articles:
- For symmetric distributions report
mean and standard deviation (SD).
- For skewed distributions report
median and interquartile range
(IQR).
, Normal distribution:
Normally when your mean is 0 and your SD
is 1 the middle 95% of the distribution will
range from -1.96 to +1.96.
Boxplot:
- Maximum
- Q3 (75th percentile)
- Median
- Q1 (first 25%/25th percentile)
- Minimum
- IQR = Q3-Q1
Scatter plot Pearson correlation:
- r = +1 perfectly positive linear association.
- r = 0 no linear association.
- r = -1 perfectly negative linear association.
Example confidence interval for mean: “What is the mean FEV1 in a population of children aged 7-10
year?”. For these 636 children, mean is 1.59. But a different sample of 636 children would result in
different mean FEV1L!
SD 0.30
1. Uncertainty quantified by standard error (SE): SEmean= = =0.012
√n √ 636
2. 95% CI:
( mean−1.96∗SEmean ; mean+ 1.96∗SEmean ) =mean± 1.96∗SEmean=1.59 ±1.96 %∗0.012=[1.57 ; 1
Example CI for proportion: “What proportion of children in a population of children aged 7-10 years
have an FEV1 <1.5L?”.
1. Uncertainty quantified by SE: SEp=
√ p∗(1− p) = √ 0.373∗0.627 =0.019
√n √636
2. 95% CI: p ±1.96∗SEp
95% CI: 0.373 ± 1.96∗0.019=[0.336 ; 0.410]
, Diagnostic testing:
- Sensitivity = P(case is correctly identified as positive) = positive cases/number of cases =
127/130 ~ 97.7%.
- Specificity = P(control is correctly identified as negative) = negative controls/number of
controls – 848/870 ~ 97.5%.
- Positive predicted value (PPV) = positive cases/number of positives = 127/149 = 85.2%.
- Negative predicted value (NPV) = negative controls/number of negatives = 848/851 = 99.6%.
- Prevalence = % cases in the population.
- CI for proportion p = 95% CI: p±1.96*SEp
o SEp =
√ p∗(1− p)
√n
o CI for PPV =
√ p∗(1− p) = √ 0.852∗0.148 =0.029
√n √ 149
95% CI: 0.852 ± 1.96*0.029 = [0.795; 0.909]
Important in SPSS:
- Command can be run directly by clicking OK, but it is recommended to first click of Past to
paste your commands into a syntax which can be saved.
- Go to the syntax editor, select all the lines of code you want to run, and press Run Selection.
- SPSS manual on Canvas.
Lecture 1: Hypothesis QQ plot: only to look at and see if it’s okay.
testing Normal distribution is always a straight line.
You plot the quantiles of your distribution against the quantiles of a normal
distribution.
Normal distribution of your data > all dots should be aligned on a linear line,
but this will not be perfect/might be small deviations.
When the data is not in line at the bottom part, the data is skewed to the
left. And when this happens at the top part the data will be skewed to the
right. But there is no clear border to say when the data is normal or not.
Divide your data into a decided number of quantiles > smaller lines at the
middle because there is more data there.
Depending on you parameters the straight line may differ.
Hypothesis testing: Does mean FEV1 differ between boys and girls? Outcomes can be a difference or
no difference. Fitting hypothesis can be:
- H0: mean FEV1 girls = mean FEV1 boys.
- Ha: mean FEV1 girls ≠ mean FEV1 boys.
Calculate the mean difference: mean boys – mean girls = 1.66 – 1.54 = 0.12 (= effect size).
Two possible solutions could be:
o Reject H0 and accept Ha.
o Do not reject H0.
o Two errors are:
Type 1 = α
Type 2 = β