MODULE 1 BIVARIATE ANALYSE, KRUISTABEL
ONDERZOEK SMAENHANG TUSSEN TWEE KWALITATIEVE VAR IABELEN
Wat weten we over onderzoek naar samenhang tussen twee kwalitatieve variabelen?
Kenmerkend: Uitkomsten kwalitatieve variabelen hebben geen afstandsinterpretatie, vaak
ook geen volgorde-interpretatie
Gevolg: Er kan alleen geteld worden hoe vaak combinaties van uitkomsten voorkomen; het
berekenen van gemiddelden of varianties is voor deze variabelen niet zinvol
Oplossingen: Maken (2-dimensionale) frequentietabellen (kruistabellen) of staafdiagrammen
Probleem: Hoe zijn samenhangen te ontdekken in kruistabellen of staafdiagrammen? Hoe
wordt statistische (on-)afhankelijkheid onderzocht?
ACHTERGROND PEARSON’S X 2 -GROOTHEID ONDERZOEK GEGEVEN KANSVERDELINGEN
Idee Pearson’s χ2-toetsgrootheid
• Twee voorbeelden berekenen verwachte frequenties en ontwikkeling van Pearson’s χ2-toetsgrootheid:
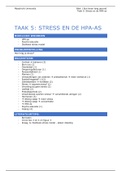
Toepassing 1: toets de veronderstelling dat de locatie van de 30 universiteiten uit het schoolvoorbeeld
uniform verdeeld is (de drie uitkomsten hebben gelijke kans, vgl. dobbelsteen)
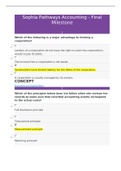
Toepassing 2: toets de veronderstelling dat de gezamenlijke verdeling van locatie en type universiteit
overeenkomt met een gegeven verdeling uit eerder onderzoek
• In beide toepassingen is de te toetsen hypothese van meet af aan volledig gespecificeerd en wordt er niet
getoetst op onafhankelijkheid
, TOEPASSING 1: GEGEVEN UNI VARIATE VERDELING
• Pearson χ2-grootheid: som gekwadrateerde verschillen
tussen waargenomen en verwachte celfrequenties gedeeld door
de verwachte celfrequenties
• De grootheid gedraagt zich onder de nulhypothese als een
χ2-verdeelde kansvariabele met K - 1 vrijheidsgraden
• Waargenomen frequenties worden verkregen uit de
steekproef; verwachte frequenties worden bepaald op basis van
de veronderstellingen beschreven door de nulhypothese
ONDERZOEK SMAENHANG TUSSEN TWEE KWALITATIEVE VAR IABELEN
Wat weten we over onderzoek naar samenhang tussen twee kwalitatieve variabelen?
Kenmerkend: Uitkomsten kwalitatieve variabelen hebben geen afstandsinterpretatie, vaak
ook geen volgorde-interpretatie
Gevolg: Er kan alleen geteld worden hoe vaak combinaties van uitkomsten voorkomen; het
berekenen van gemiddelden of varianties is voor deze variabelen niet zinvol
Oplossingen: Maken (2-dimensionale) frequentietabellen (kruistabellen) of staafdiagrammen
Probleem: Hoe zijn samenhangen te ontdekken in kruistabellen of staafdiagrammen? Hoe
wordt statistische (on-)afhankelijkheid onderzocht?
ACHTERGROND PEARSON’S X 2 -GROOTHEID ONDERZOEK GEGEVEN KANSVERDELINGEN
Idee Pearson’s χ2-toetsgrootheid
• Twee voorbeelden berekenen verwachte frequenties en ontwikkeling van Pearson’s χ2-toetsgrootheid:
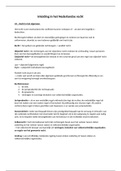
Toepassing 1: toets de veronderstelling dat de locatie van de 30 universiteiten uit het schoolvoorbeeld
uniform verdeeld is (de drie uitkomsten hebben gelijke kans, vgl. dobbelsteen)
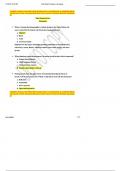
Toepassing 2: toets de veronderstelling dat de gezamenlijke verdeling van locatie en type universiteit
overeenkomt met een gegeven verdeling uit eerder onderzoek
• In beide toepassingen is de te toetsen hypothese van meet af aan volledig gespecificeerd en wordt er niet
getoetst op onafhankelijkheid
, TOEPASSING 1: GEGEVEN UNI VARIATE VERDELING
• Pearson χ2-grootheid: som gekwadrateerde verschillen
tussen waargenomen en verwachte celfrequenties gedeeld door
de verwachte celfrequenties
• De grootheid gedraagt zich onder de nulhypothese als een
χ2-verdeelde kansvariabele met K - 1 vrijheidsgraden
• Waargenomen frequenties worden verkregen uit de
steekproef; verwachte frequenties worden bepaald op basis van
de veronderstellingen beschreven door de nulhypothese