Introduction to Quantitative Methods
Chapter 1. Business Statistics
The goal of statistics and its application in business:
1. In its most basic form, descriptive statistics are used in business to summarize
collected data in meaningful numbers, think of summarizing the buying behaviour of
100 random shoppers to reflect the opinion of all shoppers and summarizing the
motivation levels of your entire workforce.
2. A more advanced application of statistics in business are interferential statistics.
Interferential statistics are used to draw sensible conclusions based on your data and
involve the application of mathematical models. With interferential statistics you can
show that there is, for instance, a relationship between motivation and performance
or that the entrepreneurial intention of one country is significantly higher than the
other country. Some people tend to use the word significantly to indicate large or
big, in the context of statistics, significant means that the study made use of
interferential statistics and that the relationship between two or more variables is
caused by something other than chance.
The symbol ∑ (sigma) is generally used to denote a sum of multiple terms.
The symbol ∏ (capital Pi) is used to denote a product of multiple terms.
So, it is a short way to denote a multiplication of many numbers.
,Chapter 2. Variables I
Level of measurement: nominal, ordinal, interval, and ratio.
Nominal just categories
Ordinal ordered categories
Interval numbers with meaningful differences
Ratio numbers with meaningful differences and a NATURAL zero
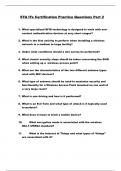
Measures of central tendency: mean, mode and median.
Mode:
The most occurring/frequent value.
Median:
The middle score for a set of data that has been arranged in order of magnitude, Thus, the
median divides the data in two parts: 50% of the data has a lower value and 50% has a
higher value.
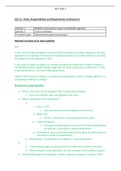
Mean (average):
Equal to the sum of all the values in the
data set divided by the number of values
in the data set. The mean has one main
disadvantage: it is particularly susceptible
to the influence of outliers. These are
values that are unusual compared to the
rest of the data set by being especially
small or large in numerical value.
, Chapter 3. Variables II
A measure of dispersion, sometimes also called a measure of spread, is used to describe the
variability in a sample or population.
It is usually used in conjunction with a measure of central tendency, for example the mean,
to give us an idea of how well the mean the data represents.
Measures of dispersion: the range, interquartile range and standard deviation.
Range = maximum value - minimum value
The Interquartile Range (IQR) is like the median based on the percentual position of the
data. We first order the data and then divide the data into four equal parts.
This gives us 3 border values: Q1, Q2 and Q3.
Q1 separates the lowest 25% of the data from the remaining 75%
Q2 the median
Q3 separates the highest 25% from the lower 75%
IQR = Q3 − Q1
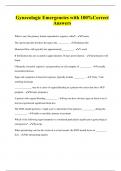
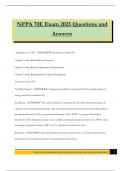
The standard deviation is a measure of the spread
of scores within a set of data.
In essence, the standard deviation is a metric that
tries to describe the average difference of each
measurement and the mean.
Population All of the people
Sample Some of the people
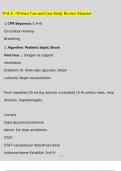
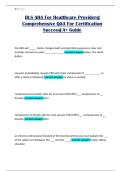
travel time
(min.)
Frequency m m*f m-mean^2 f*(m-mean^2)
9.0 -< 10.0 2 9.5 19 7.84 15.68
10.0 -< 11.0 6 10.5 63 3.24 19.44
11.0 -< 12.0 15 11.5 172.5 0.64 9.6
12.0 -< 13.0 10 12.5 125 0.04 0.4
13.0 -< 14.0 11 13.5 148.5 1.44 15.84
14.0 -< 15.0 6 14.5 87 4.84 29.04
50 72 615 18.04 90
mean = 12.3
s= 1.355262
Chapter 1. Business Statistics
The goal of statistics and its application in business:
1. In its most basic form, descriptive statistics are used in business to summarize
collected data in meaningful numbers, think of summarizing the buying behaviour of
100 random shoppers to reflect the opinion of all shoppers and summarizing the
motivation levels of your entire workforce.
2. A more advanced application of statistics in business are interferential statistics.
Interferential statistics are used to draw sensible conclusions based on your data and
involve the application of mathematical models. With interferential statistics you can
show that there is, for instance, a relationship between motivation and performance
or that the entrepreneurial intention of one country is significantly higher than the
other country. Some people tend to use the word significantly to indicate large or
big, in the context of statistics, significant means that the study made use of
interferential statistics and that the relationship between two or more variables is
caused by something other than chance.
The symbol ∑ (sigma) is generally used to denote a sum of multiple terms.
The symbol ∏ (capital Pi) is used to denote a product of multiple terms.
So, it is a short way to denote a multiplication of many numbers.
,Chapter 2. Variables I
Level of measurement: nominal, ordinal, interval, and ratio.
Nominal just categories
Ordinal ordered categories
Interval numbers with meaningful differences
Ratio numbers with meaningful differences and a NATURAL zero
Measures of central tendency: mean, mode and median.
Mode:
The most occurring/frequent value.
Median:
The middle score for a set of data that has been arranged in order of magnitude, Thus, the
median divides the data in two parts: 50% of the data has a lower value and 50% has a
higher value.
Mean (average):
Equal to the sum of all the values in the
data set divided by the number of values
in the data set. The mean has one main
disadvantage: it is particularly susceptible
to the influence of outliers. These are
values that are unusual compared to the
rest of the data set by being especially
small or large in numerical value.
, Chapter 3. Variables II
A measure of dispersion, sometimes also called a measure of spread, is used to describe the
variability in a sample or population.
It is usually used in conjunction with a measure of central tendency, for example the mean,
to give us an idea of how well the mean the data represents.
Measures of dispersion: the range, interquartile range and standard deviation.
Range = maximum value - minimum value
The Interquartile Range (IQR) is like the median based on the percentual position of the
data. We first order the data and then divide the data into four equal parts.
This gives us 3 border values: Q1, Q2 and Q3.
Q1 separates the lowest 25% of the data from the remaining 75%
Q2 the median
Q3 separates the highest 25% from the lower 75%
IQR = Q3 − Q1
The standard deviation is a measure of the spread
of scores within a set of data.
In essence, the standard deviation is a metric that
tries to describe the average difference of each
measurement and the mean.
Population All of the people
Sample Some of the people
travel time
(min.)
Frequency m m*f m-mean^2 f*(m-mean^2)
9.0 -< 10.0 2 9.5 19 7.84 15.68
10.0 -< 11.0 6 10.5 63 3.24 19.44
11.0 -< 12.0 15 11.5 172.5 0.64 9.6
12.0 -< 13.0 10 12.5 125 0.04 0.4
13.0 -< 14.0 11 13.5 148.5 1.44 15.84
14.0 -< 15.0 6 14.5 87 4.84 29.04
50 72 615 18.04 90
mean = 12.3
s= 1.355262