MATH 225N WEEK 7 LAB ASSIGNMENT, CONFIDENCE
INTERVAL
In the words of El-Masri, “To draw conclusions about a study population, researchers use
samples that they assume truly represent the population. The confidence interval (CI) is among
the most reliable indicators of the soundness of their assumption. A CI is the range of values
within which the population value being studied is believed to fall”. (Ele Massi, 2012).
Step 3: Using the data you collected for Week 5 Lab (heights of 10 different people that you
work with), discuss your method of collection for the values that you are using in your study.
What are some faults with this type of data collection? What other type of data collection could
you have used, and how might it have affected your study?
During Week 5 Lab assignment, I collected data from my coworkers ages between 24-51,
both male and female and from diverse backgrounds genetically. Some potential errors in the
collection of data would be that there was no set group used. Both genders of various ages were
used due to circumstances of available participants. In order to collect data more effectively, I
would have asked 10 males and 10 females of similar ages. In addition, there was more data
collected from females than males as there is limited male selection in the office, I work in.
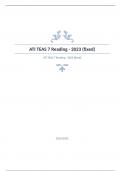
Step 4: Now use the Week 6 Spreadsheet (Links to an external site.) to help you with
calculations for the following questions/statements.
a) Give a point estimate for the average height of all people at the place where you
work. Start by putting the ten heights you are working with into the blue data column
of the spreadsheet. What is your point estimate, and what does this mean?
This study source was downloaded by 100000859565436 from CourseHero.com on 01-13-2023 15:30:18 GMT -06:00
https://www.coursehero.com/file/97103425/Math-225N-Week-7-Lab-assignment-Whetstonedocx/
INTERVAL
In the words of El-Masri, “To draw conclusions about a study population, researchers use
samples that they assume truly represent the population. The confidence interval (CI) is among
the most reliable indicators of the soundness of their assumption. A CI is the range of values
within which the population value being studied is believed to fall”. (Ele Massi, 2012).
Step 3: Using the data you collected for Week 5 Lab (heights of 10 different people that you
work with), discuss your method of collection for the values that you are using in your study.
What are some faults with this type of data collection? What other type of data collection could
you have used, and how might it have affected your study?
During Week 5 Lab assignment, I collected data from my coworkers ages between 24-51,
both male and female and from diverse backgrounds genetically. Some potential errors in the
collection of data would be that there was no set group used. Both genders of various ages were
used due to circumstances of available participants. In order to collect data more effectively, I
would have asked 10 males and 10 females of similar ages. In addition, there was more data
collected from females than males as there is limited male selection in the office, I work in.
Step 4: Now use the Week 6 Spreadsheet (Links to an external site.) to help you with
calculations for the following questions/statements.
a) Give a point estimate for the average height of all people at the place where you
work. Start by putting the ten heights you are working with into the blue data column
of the spreadsheet. What is your point estimate, and what does this mean?
This study source was downloaded by 100000859565436 from CourseHero.com on 01-13-2023 15:30:18 GMT -06:00
https://www.coursehero.com/file/97103425/Math-225N-Week-7-Lab-assignment-Whetstonedocx/