Phenotypic Plasticity
…and Norm of Reaction
Phenotypic plasticity: Exhibited when a
genotype produces different phenotypes
in different environments
Reaction norms: range of phenotypes the
results from a given genotype (coined by
Ivan Schmalhause, 1949)/depict the
phenotypes produced by each genotype in
2 or more environments
- If genotypes vary in the degree to
which their phenotype is altered by environment, then norm of reaction can
evolve
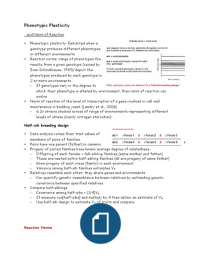
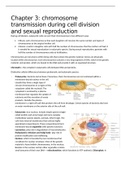
Norm of reaction of the level of transcription of a gene involved in cell wall
maintenance in budding yeast (Landry et al., 2006)
- 6 2n strains studied across of range of environments representing different
levels of stress (mainly nitrogen starvation)
Half-sib breeding design
Data analysis comes from trait values of
members of pairs of families
Pairs have one parent (father) in common
Progeny of paired families have known average degree of relatedness
- Offspring of each female = full-sibling families (same mother and father)
- These are nested within half-sibling families (all are progeny of same father)
- Grow progeny of each cross (family) in each environment
- Variance among half-sib families estimates VA
Relatives resemble each other: they share genes and environments
- Can quantify genetic resemblance between relatives by estimating genetic
covariance between specified relatives
Compare half-siblings
- Covariance among half-sibs = (1/4)VA
- If measure cov[half-sibs] and multiply by 4 then obtain an estimate of V A
- Use half-sib design to estimate VA of traits and compare
Reaction Norms
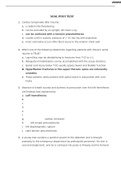
, In the 4 hypothetical examples: family (genotype) members are reared in each of 2
environments
- Line joining up mean value of each genotype in each environment depicts reaction
norm of that genotype
- Slope of line for each family indicates degree of plasticity for that family
A. Populations lack plasticity
Lines joining mean family performance are a series of
parallel lines
Phenotypic mean of each family is the same in each
environment
There is variance between families – spread of genetic
values within environments
- This variance is similar across 2 environments
Overall phenotypic mean for each environment is similar
(mean of E1 = mean of E2)
B. Populations show high degree of plasticity
Lines joining mean family performance have steep slopes
All families respond to 2 environments in similar way,
decreasing by similar amounts - their slopes are parallel
No genetic variation in plasticity – phenotypic family means
are very different between environments
In genetic variance – variance between families, in each
environment, Magnitude of this variance is similar across
the 2 environments
Overall phenotypic mean of E2 is much lower than that of
E1
C. Genotypes often respond differently to different environments
There are large differences between families in plasticity
– different slopes of reaction norms
Lines cross (no longer parallel), so phenotypic rank of
families different in 2 environments
Families respond differently to the environments =
genotype-by-environment interaction (GxE)
Still have genetic variance – variance between families –
within each environment
Overall phenotypic mean of E1 similar to that of E2
D. Another pattern of GxE interaction
Still large differences between families in plasticity
, Lines rarely cross and phenotypic rank of families is
different in 2 environments
Still have genetic variance – variance between families –
within each environment
Low variance in E1 and high variance E2
~equal number of families increased and decreased their
phenotype – hence overall phenotypic means of E1 and E2
are similar
To summarise…
Via 2 –way ANOVA: 2 main factors are Genotype (sire/family) and Environment
- Individuals at each level of factor are represented at each level of the other
factor
- Members of each half-sib family in each environment
Outcomes
- Significant sire/family effect (Genotype, G)? Evidence for overall additive
genetic variance for the trait
- Significant environment € effect? Evidence of overall plasticity
- Significant G-by-E interaction? Evidence for additive variance for plasticity
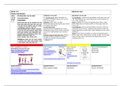
Examples of G by E interactions (common)
If there is G by E, plastic responses can
evolve
Can study the evolution of plasticity using
artificial selection
Body size and rearing temperature in 1 strain
of Drosophila
- If grown at low temperature, flies have
small body size, if grown at high temperature, flies are larger
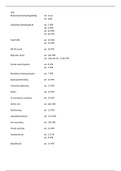
- Scheiner and Lyman – reared families and then reared siblings at either 19 oC or
25oC
- Difference in size of warm and cold-reared siblings varied from family to family
- Artificial selection – after 22 generations
High/increased plasticity – only flies with greatest size difference between
temperatures allowed to breed
Low/reduced plasticity – only flies with smallest size difference between
temperatures allowed to breed
- See a direct response to selection in high and low lines – amount of phenotypic
plasticity had evolved in response to selection
…and Norm of Reaction
Phenotypic plasticity: Exhibited when a
genotype produces different phenotypes
in different environments
Reaction norms: range of phenotypes the
results from a given genotype (coined by
Ivan Schmalhause, 1949)/depict the
phenotypes produced by each genotype in
2 or more environments
- If genotypes vary in the degree to
which their phenotype is altered by environment, then norm of reaction can
evolve
Norm of reaction of the level of transcription of a gene involved in cell wall
maintenance in budding yeast (Landry et al., 2006)
- 6 2n strains studied across of range of environments representing different
levels of stress (mainly nitrogen starvation)
Half-sib breeding design
Data analysis comes from trait values of
members of pairs of families
Pairs have one parent (father) in common
Progeny of paired families have known average degree of relatedness
- Offspring of each female = full-sibling families (same mother and father)
- These are nested within half-sibling families (all are progeny of same father)
- Grow progeny of each cross (family) in each environment
- Variance among half-sib families estimates VA
Relatives resemble each other: they share genes and environments
- Can quantify genetic resemblance between relatives by estimating genetic
covariance between specified relatives
Compare half-siblings
- Covariance among half-sibs = (1/4)VA
- If measure cov[half-sibs] and multiply by 4 then obtain an estimate of V A
- Use half-sib design to estimate VA of traits and compare
Reaction Norms
, In the 4 hypothetical examples: family (genotype) members are reared in each of 2
environments
- Line joining up mean value of each genotype in each environment depicts reaction
norm of that genotype
- Slope of line for each family indicates degree of plasticity for that family
A. Populations lack plasticity
Lines joining mean family performance are a series of
parallel lines
Phenotypic mean of each family is the same in each
environment
There is variance between families – spread of genetic
values within environments
- This variance is similar across 2 environments
Overall phenotypic mean for each environment is similar
(mean of E1 = mean of E2)
B. Populations show high degree of plasticity
Lines joining mean family performance have steep slopes
All families respond to 2 environments in similar way,
decreasing by similar amounts - their slopes are parallel
No genetic variation in plasticity – phenotypic family means
are very different between environments
In genetic variance – variance between families, in each
environment, Magnitude of this variance is similar across
the 2 environments
Overall phenotypic mean of E2 is much lower than that of
E1
C. Genotypes often respond differently to different environments
There are large differences between families in plasticity
– different slopes of reaction norms
Lines cross (no longer parallel), so phenotypic rank of
families different in 2 environments
Families respond differently to the environments =
genotype-by-environment interaction (GxE)
Still have genetic variance – variance between families –
within each environment
Overall phenotypic mean of E1 similar to that of E2
D. Another pattern of GxE interaction
Still large differences between families in plasticity
, Lines rarely cross and phenotypic rank of families is
different in 2 environments
Still have genetic variance – variance between families –
within each environment
Low variance in E1 and high variance E2
~equal number of families increased and decreased their
phenotype – hence overall phenotypic means of E1 and E2
are similar
To summarise…
Via 2 –way ANOVA: 2 main factors are Genotype (sire/family) and Environment
- Individuals at each level of factor are represented at each level of the other
factor
- Members of each half-sib family in each environment
Outcomes
- Significant sire/family effect (Genotype, G)? Evidence for overall additive
genetic variance for the trait
- Significant environment € effect? Evidence of overall plasticity
- Significant G-by-E interaction? Evidence for additive variance for plasticity
Examples of G by E interactions (common)
If there is G by E, plastic responses can
evolve
Can study the evolution of plasticity using
artificial selection
Body size and rearing temperature in 1 strain
of Drosophila
- If grown at low temperature, flies have
small body size, if grown at high temperature, flies are larger
- Scheiner and Lyman – reared families and then reared siblings at either 19 oC or
25oC
- Difference in size of warm and cold-reared siblings varied from family to family
- Artificial selection – after 22 generations
High/increased plasticity – only flies with greatest size difference between
temperatures allowed to breed
Low/reduced plasticity – only flies with smallest size difference between
temperatures allowed to breed
- See a direct response to selection in high and low lines – amount of phenotypic
plasticity had evolved in response to selection