Knowledge clip 1: Key concepts
Independent variables (causes) are what we expect will influence dependent variables (effects)
→ FEX. amount of stress -> job satisfaction → duration of symptoms -> quality of life → medical
procedure -> cured (yes/no) → BUT, relationships between variables may be ones of association,
but this does not necessarily imply causality (=when changes in one variable lead to changes in
another) → an effect can also be influenced by another factor → independent and dependent
variables can be testen in an experiment (external variables must be controlled for (so they don’t
influence the outcomes), can be done by elimination (people with this variable do not participate
in the study) and randomisation.
Population = the entire group/the total number of units that you want to draw conclusions
about → too many to study, so take a sample (needs to be representable of the population,
sampling error if findings do not reflect the general perspective of the population) → two
important sampling techniques:
- Random probability sampling: each unit or member has an equal chance of being
selected → need a list of all members of a population (sampling frame), which is not
always realistic.
- Stratefied random sampling: non-random sample.
types of statistics: descriptive statistics = (not generalisable) summarize the data of the sample,
udentify patterns and generate hypotheses → inferential statistics = draw conclusions about the
population, distinguish true differences from random variation and allow for hypothesis testing.
Hypothesis testing:
- H0 = no difference between the groups we are
interested in → both samples/groups come from
the same underlying population.
- HA = assess the possibility of an alternate
hypothesis → there is a difference between the
groups → samples come from different
underlying populations.
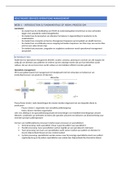
Types of data: picture right → difference ratio and
interval: whether there is a true zero (with age and
income there is, but for IQ the score 0 does not exist) →
difference ordinal and nominal: for ordinal, the intervals between the ranks are not meant to be
equal (educational levels).
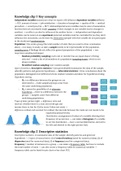
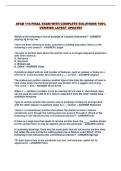
Distribution: arrangement of values of a variable showing their
frequency of occurrence → can make a histogram of a variable
to see the distribution → have a normal distribution, skewed to
the left and skewed to the right (picture left).
Knowledge clip 2: Descriptive statistics
Descriptive statistics: to summarise data of the sample, identify patterns and generate
hypotheses → 3 types of measurement: (1) of central tendency (used for numerical data), (2) of
dispersion (used for numerical data), (3) of fequency (used for categorical data).
Frequency = number of instances in a group → can make a frequency table, but have to include
the total number of units → can also create a frequency table for numerical variables →
frequency table can be basis for pie chart or bar chart FEX.
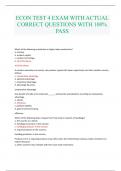
, Measures of central tendency: mean = average - median = central value when all scores
are arranged in order → mode = the most frequently occurring value (picture right).
→ with extreme values there is a skewed distribution and the median is a better
measure of central tendency than the mean (FEX. when a millionair is living in a town,
the mean income is very high, but the median stays more or less the same).
Measures of dispersion:
- range = the difference between the largest value and the smallest value.
- inter-quartile range = difference between the median from the upper half
(third quartile) and the median from the lower half (first quartile) → FEX. 62 to 81, range =
19 - inter-quartile range is 13 (median=71, median upper half = 77, median lower half = 64).
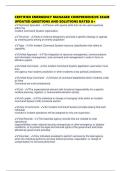
- variance (σ²) = average of squared deviations of individual scores from the mean (takes
into account spread of all data points in the data set) → most often used → starts with
calculating the mean, the difference between all data points
and the mean and then square root this difference (do this for
every data point) → the average of all these numbers is the
variance (example picture left).
- standard deviation (σ) = square root of the variance.
→ range, variance and standard deviation are sensitive to
extreme values (therefore misrepresent the dispersion) → better to use the inter-quartile range.
Knowledge clip 3: Inferential statistics
Inferential statistics = making inferences about populations using sample data that is drawn
from the population → look into relations and associations between the outcome variable
(dependent variable) and the exposure variable (independent variable) → you infer the outcomes
of the sample to the whole population.
Probability = to say something about how likely we are to observe the association seen in our
sample to our entire population → some probabilities can be calculated exactly (FEX. rolling a
dice (1/6 = 16.7%)) → more complicated with population research → instead of using
approximate probability we have to use a known probability distribution.
- Probability distribution: a representation of probabilities of events within a particular
sample space → it tells you what the probability of an event is (FEX. probability of a drug
in treating a disease) → using probability curves to see whether the drug is effective.
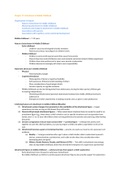
- normal distribution: (Gaussian distribution) to describe
numeric variables with a certain population mean (µ) &
population standard deviation (σ) → many natural
measurements in the real world follow a normal distribution
(heights of people, blood pressure, IQ scores, etc.) → follow a
normal distribution curve, also called bell shaped curve
(hump shows averages, left side below average, right is above)
→ picture right → BUT, the normal distribution is a theoretical
distribution: no real data will truly be normally distributed (at
the sample/population level), however, some data approximate a normal curve
pretty well → what if data is not normally distributed?
→ how to deal with non-normal data: (1) Data cleaning (take out missing values), (2) Excluding
outliers, (3) Logarithmic transformation (transforming into a natural logarithmic to see whether
it approximates a normal distribution), (4) Non-parametric testing.
Independent variables (causes) are what we expect will influence dependent variables (effects)
→ FEX. amount of stress -> job satisfaction → duration of symptoms -> quality of life → medical
procedure -> cured (yes/no) → BUT, relationships between variables may be ones of association,
but this does not necessarily imply causality (=when changes in one variable lead to changes in
another) → an effect can also be influenced by another factor → independent and dependent
variables can be testen in an experiment (external variables must be controlled for (so they don’t
influence the outcomes), can be done by elimination (people with this variable do not participate
in the study) and randomisation.
Population = the entire group/the total number of units that you want to draw conclusions
about → too many to study, so take a sample (needs to be representable of the population,
sampling error if findings do not reflect the general perspective of the population) → two
important sampling techniques:
- Random probability sampling: each unit or member has an equal chance of being
selected → need a list of all members of a population (sampling frame), which is not
always realistic.
- Stratefied random sampling: non-random sample.
types of statistics: descriptive statistics = (not generalisable) summarize the data of the sample,
udentify patterns and generate hypotheses → inferential statistics = draw conclusions about the
population, distinguish true differences from random variation and allow for hypothesis testing.
Hypothesis testing:
- H0 = no difference between the groups we are
interested in → both samples/groups come from
the same underlying population.
- HA = assess the possibility of an alternate
hypothesis → there is a difference between the
groups → samples come from different
underlying populations.
Types of data: picture right → difference ratio and
interval: whether there is a true zero (with age and
income there is, but for IQ the score 0 does not exist) →
difference ordinal and nominal: for ordinal, the intervals between the ranks are not meant to be
equal (educational levels).
Distribution: arrangement of values of a variable showing their
frequency of occurrence → can make a histogram of a variable
to see the distribution → have a normal distribution, skewed to
the left and skewed to the right (picture left).
Knowledge clip 2: Descriptive statistics
Descriptive statistics: to summarise data of the sample, identify patterns and generate
hypotheses → 3 types of measurement: (1) of central tendency (used for numerical data), (2) of
dispersion (used for numerical data), (3) of fequency (used for categorical data).
Frequency = number of instances in a group → can make a frequency table, but have to include
the total number of units → can also create a frequency table for numerical variables →
frequency table can be basis for pie chart or bar chart FEX.
, Measures of central tendency: mean = average - median = central value when all scores
are arranged in order → mode = the most frequently occurring value (picture right).
→ with extreme values there is a skewed distribution and the median is a better
measure of central tendency than the mean (FEX. when a millionair is living in a town,
the mean income is very high, but the median stays more or less the same).
Measures of dispersion:
- range = the difference between the largest value and the smallest value.
- inter-quartile range = difference between the median from the upper half
(third quartile) and the median from the lower half (first quartile) → FEX. 62 to 81, range =
19 - inter-quartile range is 13 (median=71, median upper half = 77, median lower half = 64).
- variance (σ²) = average of squared deviations of individual scores from the mean (takes
into account spread of all data points in the data set) → most often used → starts with
calculating the mean, the difference between all data points
and the mean and then square root this difference (do this for
every data point) → the average of all these numbers is the
variance (example picture left).
- standard deviation (σ) = square root of the variance.
→ range, variance and standard deviation are sensitive to
extreme values (therefore misrepresent the dispersion) → better to use the inter-quartile range.
Knowledge clip 3: Inferential statistics
Inferential statistics = making inferences about populations using sample data that is drawn
from the population → look into relations and associations between the outcome variable
(dependent variable) and the exposure variable (independent variable) → you infer the outcomes
of the sample to the whole population.
Probability = to say something about how likely we are to observe the association seen in our
sample to our entire population → some probabilities can be calculated exactly (FEX. rolling a
dice (1/6 = 16.7%)) → more complicated with population research → instead of using
approximate probability we have to use a known probability distribution.
- Probability distribution: a representation of probabilities of events within a particular
sample space → it tells you what the probability of an event is (FEX. probability of a drug
in treating a disease) → using probability curves to see whether the drug is effective.
- normal distribution: (Gaussian distribution) to describe
numeric variables with a certain population mean (µ) &
population standard deviation (σ) → many natural
measurements in the real world follow a normal distribution
(heights of people, blood pressure, IQ scores, etc.) → follow a
normal distribution curve, also called bell shaped curve
(hump shows averages, left side below average, right is above)
→ picture right → BUT, the normal distribution is a theoretical
distribution: no real data will truly be normally distributed (at
the sample/population level), however, some data approximate a normal curve
pretty well → what if data is not normally distributed?
→ how to deal with non-normal data: (1) Data cleaning (take out missing values), (2) Excluding
outliers, (3) Logarithmic transformation (transforming into a natural logarithmic to see whether
it approximates a normal distribution), (4) Non-parametric testing.