Inhoudsopgave
MODULE 1 – WEB LECTURE: UNCERTAINTY (24/10-30/10) ................................................................ 3
Knowledge Clip 1.1: Test & Roll (04:46) ................................................................................. 3
Knowledge Clip 1.2: Value of Testing (03:56)...................................................................... 4
Knowledge Clip 1.3: Classical Uncertainty (08:12) .......................................................... 4
Knowledge Clip 1.4: Bayesian Uncertainty (11:26) ............................................................ 5
Knowledge Clip 1.5: Comparing Posteriors (11:53) ............................................................ 7
Knowledge Clip 1.6: Size of Test Group (11:53) ................................................................. 9
MODULE 2 – WEB LECTURE: RFM (31/10-06/11)................................................................................. 11
Knowledge Clip 2.1: RFM (31:30) .................................................................................................. 11
Knowledge Clip 2.2: Empirical Bayes & Clump (21:48) ................................................... 12
MODULE 3 – WEB LECTURE: LOGISTIC REGRESSION (07/11-13/11) ................................................ 14
Knowledge Clip 3.1: Churn (04:44) ............................................................................................. 14
Knowledge Clip 3.2: Logistic Regression (23:01)............................................................. 15
Knowledge Clip 3.3: Interpreting Output (09:18)............................................................. 17
Knowledge Clip 3.4: Overfitting (16:24) ............................................................................... 17
Knowledge Clip 3.5: Lifts and Optimal Targeting (24:32) .......................................... 19
MODULE 4 – WEB LECTURE: SUBSET SELECTION, LASSO, DECISION TREES, AND RANDOM
FORESTS (14/11-20/11) ........................................................................................................................... 21
Knowledge Clip 4.1: Subset Selection (16:39).................................................................... 21
Knowledge Clip 4.2: LASSO (14:24) ............................................................................................. 22
Knowledge Clip 4.3: Decision Trees (14:58) ........................................................................ 24
Knowledge Clip 4.4: Random Forests (08:05) ........................................................................ 26
MODULE 5 – WEB LECTURE: COLLABORATIVE FILTERING, CROSS-SELLING, UPSELLING (21/11-
27/11) ......................................................................................................................................................... 28
Knowledge Clip 5.1: NPTB Models (10:23) ............................................................................... 28
Knowledge Clip 5.2: Recommender Systems – Intro (08:00) .......................................... 29
Knowledge Clip 5.3: Recommender Systems – Models (24:00)........................................ 29
MODULE 6 – WEB LECTURE: CUSTOMER LIFETIME VALUE IN CONTRACTUAL SETTINGS (28/11-
04/12) ......................................................................................................................................................... 33
Knowledge Clip 6.1: CLV: Definition (12:22) ...................................................................... 33
Knowledge Clip 6.2: CLV: Geometric Model (19:20) .......................................................... 33
Knowledge Clip 6.3: RLV, uses of CLV (08:19).................................................................... 35
Knowledge Clip 6.4: Heterogeneity and Retention Rates (09:16) ............................ 36
, Knowledge Clip 6.5: sBG Model (26:30) .................................................................................... 38
MODULE 7 – WEB LECTURE: CUSTOMER LIFETIME VALUE IN NON-CONTRACTUAL SETTINGS
(05/12-11/12) ............................................................................................................................................ 42
Knowledge Clip 7.1: Noncontractual (29:51) ........................................................................ 42
Knowledge Clip 7.2: Beta-Geometric, Beta-Binomial (BG/BB) (09:59) ................... 43
Knowledge Clip 7.3: Interpreting BG/BB Results (11:44) ............................................ 44
Knowledge Clip 7.4: CLV RLV (06:46) ........................................................................................ 46
Knowledge Clip 7.5: Extensions (12:42) ................................................................................. 47
,MODULE 1 – WEB LECTURE: UNCERTAINTY (24/10-30/10)
Literature
Blattberg, R.C., Kim, B-D., & Neslin, S.A. (2008). Database Marketing: Analyzing and Managing Customers.
Springer.
• Chapter 9: Test Design and Analysis
- Section 9.1: The Importance of Testing
- Section 9.2: To Test or Not to Test
Feit, E.M., & Berman, R. (2019). Test & Roll: Profit-Maximizing A/B Tests. Marketing Science, 38(6), 1038-
1058. Sections 1-2 and 5 (skim others).
Optional: Stats With R – An Introduction to Bayesian Thinking
• Chapter 1: The Basics of Bayesian Statistics (https://statswithr.github.io/book/the-basics-of-
bayesian-statistics.html)
• Chapter 2: Bayesian Inference (https://statswithr.github.io/book/bayesian-inference.html)
Knowledge clips:
• Knowledge Clip 1.1: Test & Roll (04:46)
• Knowledge Clip 1.2: Value of Testing (03:56)
• Knowledge Clip 1.3: Classical Uncertainty (08:12)
• Knowledge Clip 1.4: Bayesian Uncertainty (11:26)
• Knowledge Clip 1.5: Comparing Posteriors (11:53)
• Knowledge Clip 1.6: Size of Test Group (11:53)
Knowledge Clip 1.1: Test & Roll (04:46)
To start off this knowledge clip, an example was introduced. The company E-beer sells beer on the
Internet, and currently has 50,000 customers. To boost sales, the E-beer sends a catalog to their
customers. Each mailing costs €1.50. Hence, sending the catalog to all customers means a total cost of
€1.50 × 50,000 = €75,000. The company now has to assess somehow if this is worth it. In other words,
doo the benefits of sending the catalog to all 50,000 customers outweigh the total costs of €75,000?
This question can be answered by a test & roll experiment. You get some information on how effective
your marketing is (the test) before you send it out to everyone (the rollout). We take three steps:
1. Randomly select some subset of customers, which is the test sample (size = 𝑛).
2. Send your test sample the mailing, collect and analyze the responses.
3. Use the results to decide whether to send the mailing to the rest of the population (size 𝑁 − 𝑛,
the rollout sample).
We assume that the test sample size is 5,000. From our mailing, 175 out of 5,000 customers respond.
Hence, the estimated response rate 𝑝̂ = 175/5000 = 0.035. The estimated profit per response is 𝑚 =
€50. We can now calculate the expected rollout profits:
𝐸[𝑟𝑜𝑙𝑙𝑜𝑢𝑡 𝑝𝑟𝑜𝑓𝑖𝑡] = (𝑁 − 𝑛) × (𝑚 × 𝑝̂ − 𝑐) = (50,000 − 5,000) × (€50 × 0.035 − €1.50)
= 45,000 × €0.25 = €11,250
Where 𝑚 is the margin (profit) per response, 𝑝̂ is the estimated response rate, and 𝑐 is the marketing
cost. Therefore, because our expected rollout profit is positive, we roll it out to the rest of the sample.
The test gives us the option – not the obligation – to rollout. We only roll out when:
𝐸[𝑟𝑜𝑙𝑙𝑜𝑢𝑡 𝑝𝑟𝑜𝑓𝑖𝑡] > 0
Or, in other words, when:
𝑐
𝑚 × 𝑝̂ − 𝑐 > 0 → 𝑝̂ >
𝑚
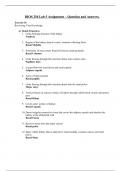
, Knowledge Clip 1.2: Value of Testing
(03:56)
To visualize the profits, a decision tree was shown.
Furthermore, the following three assumptions were
introduced:
• The test provides perfect information.
• The test predicts:
o Success (𝑝 = 0.05), leading to
𝑚 × 𝑝 − 𝑐 = 1.00
o Failure (𝑝 = 0.01), leading to 𝑚 × 𝑝 −
𝑐 = −1.00
• Success occurs 30% of the time.
First, we have to choose whether to test or not. You
might choose to not do a test at all. If you know the
success rate is only 30%, then:
0.3 × 1.00 + 0.7 × −1.00 = −0.4
In this case, your profit is €0.
If you choose to do a test, there is a 30% success rate. In the case of success, you will send out the
mailing to the rest of your customer base, so a total of 50,000 customers. In this case, your profit equals
50,000 × (€50 × 0.05 − €1.50) = €50,000. In the case of failure (70% chance), you will not send out the
mailing to the rest of your customer base (restrict it to the test sample). In this case, your losses equal
5,000 × (€50 × 0.01 − €1.50) = −€5,000. Hence, we can calculate the value of the test as:
𝑉𝑎𝑙𝑢𝑒 𝑜𝑓 𝑇𝑒𝑠𝑡 = 𝐸[𝑝𝑟𝑜𝑓𝑖𝑡|𝑡𝑒𝑠𝑡] − 𝐸[𝑝𝑟𝑜𝑓𝑖𝑡|𝑛𝑜 𝑡𝑒𝑠𝑡] = 0.3 × €50,000 + 0.7 × −€5,000 = €11,500
Knowledge Clip 1.3: Classical Uncertainty (08:12)
However, we have not taken uncertainty into account yet. The true unobserved population response rate
is 𝑝 (without the hat). What we observe in our previous example, is the sample mean estimate:
1
𝑝̂ = L 𝑥!
𝑛 !
Which means, for each customer in the sample size 𝑛, we sum up the individual profits 𝑥! , and divide
the sum of this by 𝑛. This is the sample mean estimate 𝑝̂ , which we earlier calculated to be 𝑝̂ = 0.035.
The accompanying standard error is equal to:
𝜎" 𝑝(1 − 𝑝)
𝑠𝑒(𝑝) = N = N
𝑛 𝑛
Hence, for 𝑝̂ = 0.035, the accompanying standard error is:
𝑝(1 − 𝑝) (0.035) × (1 − 0.035)
𝑠𝑒(𝑝) = N =N
𝑛 5,000
According to the central limit theorem, if the sample size is large enough, the distribution of the sample
mean is approximately normal.
𝑝̂ ~ 𝑁(𝑝, 𝑠𝑒(𝑝)" )
In other words, the sample mean estimate 𝑝̂ is centered on the true value of 𝑝, which we do not
observe, and its accompanying variance 𝑠𝑒(𝑝)" .
Now, we want to calculate the probability that we make a mistake. Earlier, we found out that our
response rate 𝑝 has to be bigger than 𝑐/𝑚. Hence:
𝑐 €1.50
𝑝> →𝑝> → 𝑝 > 0.03
𝑚 €50
Hence, if 𝑝 < 0.03, we make a loss (𝐸[𝜋] < 0). Otherwise, if 𝑝 > 0.03, we make a profit (𝐸[𝜋] > 0).
MODULE 1 – WEB LECTURE: UNCERTAINTY (24/10-30/10) ................................................................ 3
Knowledge Clip 1.1: Test & Roll (04:46) ................................................................................. 3
Knowledge Clip 1.2: Value of Testing (03:56)...................................................................... 4
Knowledge Clip 1.3: Classical Uncertainty (08:12) .......................................................... 4
Knowledge Clip 1.4: Bayesian Uncertainty (11:26) ............................................................ 5
Knowledge Clip 1.5: Comparing Posteriors (11:53) ............................................................ 7
Knowledge Clip 1.6: Size of Test Group (11:53) ................................................................. 9
MODULE 2 – WEB LECTURE: RFM (31/10-06/11)................................................................................. 11
Knowledge Clip 2.1: RFM (31:30) .................................................................................................. 11
Knowledge Clip 2.2: Empirical Bayes & Clump (21:48) ................................................... 12
MODULE 3 – WEB LECTURE: LOGISTIC REGRESSION (07/11-13/11) ................................................ 14
Knowledge Clip 3.1: Churn (04:44) ............................................................................................. 14
Knowledge Clip 3.2: Logistic Regression (23:01)............................................................. 15
Knowledge Clip 3.3: Interpreting Output (09:18)............................................................. 17
Knowledge Clip 3.4: Overfitting (16:24) ............................................................................... 17
Knowledge Clip 3.5: Lifts and Optimal Targeting (24:32) .......................................... 19
MODULE 4 – WEB LECTURE: SUBSET SELECTION, LASSO, DECISION TREES, AND RANDOM
FORESTS (14/11-20/11) ........................................................................................................................... 21
Knowledge Clip 4.1: Subset Selection (16:39).................................................................... 21
Knowledge Clip 4.2: LASSO (14:24) ............................................................................................. 22
Knowledge Clip 4.3: Decision Trees (14:58) ........................................................................ 24
Knowledge Clip 4.4: Random Forests (08:05) ........................................................................ 26
MODULE 5 – WEB LECTURE: COLLABORATIVE FILTERING, CROSS-SELLING, UPSELLING (21/11-
27/11) ......................................................................................................................................................... 28
Knowledge Clip 5.1: NPTB Models (10:23) ............................................................................... 28
Knowledge Clip 5.2: Recommender Systems – Intro (08:00) .......................................... 29
Knowledge Clip 5.3: Recommender Systems – Models (24:00)........................................ 29
MODULE 6 – WEB LECTURE: CUSTOMER LIFETIME VALUE IN CONTRACTUAL SETTINGS (28/11-
04/12) ......................................................................................................................................................... 33
Knowledge Clip 6.1: CLV: Definition (12:22) ...................................................................... 33
Knowledge Clip 6.2: CLV: Geometric Model (19:20) .......................................................... 33
Knowledge Clip 6.3: RLV, uses of CLV (08:19).................................................................... 35
Knowledge Clip 6.4: Heterogeneity and Retention Rates (09:16) ............................ 36
, Knowledge Clip 6.5: sBG Model (26:30) .................................................................................... 38
MODULE 7 – WEB LECTURE: CUSTOMER LIFETIME VALUE IN NON-CONTRACTUAL SETTINGS
(05/12-11/12) ............................................................................................................................................ 42
Knowledge Clip 7.1: Noncontractual (29:51) ........................................................................ 42
Knowledge Clip 7.2: Beta-Geometric, Beta-Binomial (BG/BB) (09:59) ................... 43
Knowledge Clip 7.3: Interpreting BG/BB Results (11:44) ............................................ 44
Knowledge Clip 7.4: CLV RLV (06:46) ........................................................................................ 46
Knowledge Clip 7.5: Extensions (12:42) ................................................................................. 47
,MODULE 1 – WEB LECTURE: UNCERTAINTY (24/10-30/10)
Literature
Blattberg, R.C., Kim, B-D., & Neslin, S.A. (2008). Database Marketing: Analyzing and Managing Customers.
Springer.
• Chapter 9: Test Design and Analysis
- Section 9.1: The Importance of Testing
- Section 9.2: To Test or Not to Test
Feit, E.M., & Berman, R. (2019). Test & Roll: Profit-Maximizing A/B Tests. Marketing Science, 38(6), 1038-
1058. Sections 1-2 and 5 (skim others).
Optional: Stats With R – An Introduction to Bayesian Thinking
• Chapter 1: The Basics of Bayesian Statistics (https://statswithr.github.io/book/the-basics-of-
bayesian-statistics.html)
• Chapter 2: Bayesian Inference (https://statswithr.github.io/book/bayesian-inference.html)
Knowledge clips:
• Knowledge Clip 1.1: Test & Roll (04:46)
• Knowledge Clip 1.2: Value of Testing (03:56)
• Knowledge Clip 1.3: Classical Uncertainty (08:12)
• Knowledge Clip 1.4: Bayesian Uncertainty (11:26)
• Knowledge Clip 1.5: Comparing Posteriors (11:53)
• Knowledge Clip 1.6: Size of Test Group (11:53)
Knowledge Clip 1.1: Test & Roll (04:46)
To start off this knowledge clip, an example was introduced. The company E-beer sells beer on the
Internet, and currently has 50,000 customers. To boost sales, the E-beer sends a catalog to their
customers. Each mailing costs €1.50. Hence, sending the catalog to all customers means a total cost of
€1.50 × 50,000 = €75,000. The company now has to assess somehow if this is worth it. In other words,
doo the benefits of sending the catalog to all 50,000 customers outweigh the total costs of €75,000?
This question can be answered by a test & roll experiment. You get some information on how effective
your marketing is (the test) before you send it out to everyone (the rollout). We take three steps:
1. Randomly select some subset of customers, which is the test sample (size = 𝑛).
2. Send your test sample the mailing, collect and analyze the responses.
3. Use the results to decide whether to send the mailing to the rest of the population (size 𝑁 − 𝑛,
the rollout sample).
We assume that the test sample size is 5,000. From our mailing, 175 out of 5,000 customers respond.
Hence, the estimated response rate 𝑝̂ = 175/5000 = 0.035. The estimated profit per response is 𝑚 =
€50. We can now calculate the expected rollout profits:
𝐸[𝑟𝑜𝑙𝑙𝑜𝑢𝑡 𝑝𝑟𝑜𝑓𝑖𝑡] = (𝑁 − 𝑛) × (𝑚 × 𝑝̂ − 𝑐) = (50,000 − 5,000) × (€50 × 0.035 − €1.50)
= 45,000 × €0.25 = €11,250
Where 𝑚 is the margin (profit) per response, 𝑝̂ is the estimated response rate, and 𝑐 is the marketing
cost. Therefore, because our expected rollout profit is positive, we roll it out to the rest of the sample.
The test gives us the option – not the obligation – to rollout. We only roll out when:
𝐸[𝑟𝑜𝑙𝑙𝑜𝑢𝑡 𝑝𝑟𝑜𝑓𝑖𝑡] > 0
Or, in other words, when:
𝑐
𝑚 × 𝑝̂ − 𝑐 > 0 → 𝑝̂ >
𝑚
, Knowledge Clip 1.2: Value of Testing
(03:56)
To visualize the profits, a decision tree was shown.
Furthermore, the following three assumptions were
introduced:
• The test provides perfect information.
• The test predicts:
o Success (𝑝 = 0.05), leading to
𝑚 × 𝑝 − 𝑐 = 1.00
o Failure (𝑝 = 0.01), leading to 𝑚 × 𝑝 −
𝑐 = −1.00
• Success occurs 30% of the time.
First, we have to choose whether to test or not. You
might choose to not do a test at all. If you know the
success rate is only 30%, then:
0.3 × 1.00 + 0.7 × −1.00 = −0.4
In this case, your profit is €0.
If you choose to do a test, there is a 30% success rate. In the case of success, you will send out the
mailing to the rest of your customer base, so a total of 50,000 customers. In this case, your profit equals
50,000 × (€50 × 0.05 − €1.50) = €50,000. In the case of failure (70% chance), you will not send out the
mailing to the rest of your customer base (restrict it to the test sample). In this case, your losses equal
5,000 × (€50 × 0.01 − €1.50) = −€5,000. Hence, we can calculate the value of the test as:
𝑉𝑎𝑙𝑢𝑒 𝑜𝑓 𝑇𝑒𝑠𝑡 = 𝐸[𝑝𝑟𝑜𝑓𝑖𝑡|𝑡𝑒𝑠𝑡] − 𝐸[𝑝𝑟𝑜𝑓𝑖𝑡|𝑛𝑜 𝑡𝑒𝑠𝑡] = 0.3 × €50,000 + 0.7 × −€5,000 = €11,500
Knowledge Clip 1.3: Classical Uncertainty (08:12)
However, we have not taken uncertainty into account yet. The true unobserved population response rate
is 𝑝 (without the hat). What we observe in our previous example, is the sample mean estimate:
1
𝑝̂ = L 𝑥!
𝑛 !
Which means, for each customer in the sample size 𝑛, we sum up the individual profits 𝑥! , and divide
the sum of this by 𝑛. This is the sample mean estimate 𝑝̂ , which we earlier calculated to be 𝑝̂ = 0.035.
The accompanying standard error is equal to:
𝜎" 𝑝(1 − 𝑝)
𝑠𝑒(𝑝) = N = N
𝑛 𝑛
Hence, for 𝑝̂ = 0.035, the accompanying standard error is:
𝑝(1 − 𝑝) (0.035) × (1 − 0.035)
𝑠𝑒(𝑝) = N =N
𝑛 5,000
According to the central limit theorem, if the sample size is large enough, the distribution of the sample
mean is approximately normal.
𝑝̂ ~ 𝑁(𝑝, 𝑠𝑒(𝑝)" )
In other words, the sample mean estimate 𝑝̂ is centered on the true value of 𝑝, which we do not
observe, and its accompanying variance 𝑠𝑒(𝑝)" .
Now, we want to calculate the probability that we make a mistake. Earlier, we found out that our
response rate 𝑝 has to be bigger than 𝑐/𝑚. Hence:
𝑐 €1.50
𝑝> →𝑝> → 𝑝 > 0.03
𝑚 €50
Hence, if 𝑝 < 0.03, we make a loss (𝐸[𝜋] < 0). Otherwise, if 𝑝 > 0.03, we make a profit (𝐸[𝜋] > 0).