Growth, Institutions and Business Summary
Chapter 1 - The Facts to be Explained
Differences in people’s living standards are striking. In the last two centuries there is
a explosion of economic growth. But growth of income has been uneven. After World
War II, the average rate of growth of world income increased, but some parts of the
world failed to grow.
GDP = Gross Domestic Product = measure of the value of all of the goods and
services produced in a country in a year (national income)
- value of output produced in a country
- total income; wages, rents, interest, and profits
PPP = Purchasing power parity = based on the prices of a standardized basket of
goods and services, both traded and non-traded good.
Measure GDP with other sources of data to be sure.
- Amount of light that is visible at night from outer space
- HDI = Human Development Index
- Happiness
Problems GDP:
- exchange rate fluctuate daily
- only traded goods (price ratio differs in non-traded goods)
Using PPP exchange rates gives a more accurate picture.
With a standardized basket of goods and services, it is easy to determine how much
wage you need for the basket in each country. Because of the difference in price
level between countries, you should need more wage in a country with a high price
level to obtain the basket and less wage in a country with a low price level to obtain
the same basket.
20% of world population that lives in the richest countries receives 60% of world
income.
Growth rates of income = how quickly their income per capita is rising.
Growth is important because a country that grows faster will move to a higher level of
income over time
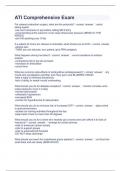
Ratio scale = equal spaces on the vertical axis correspond to equal proportional
differences in the variable being graphed
Rule of 72 = formula estimating the amount of time it takes something growing at a
given rate to double = 72/g
growth rate = Xt+1 – Xt / Xt g = (Xt+n/Xt)1/n – 1
Xt+n = Xt * (1+g)n
Growth is a long-run phenomenon. USA (Great Depression, World War II and
recession of 1974, 1982, 2018). Japan (End of World War II and 1973).
,Comparing countries makes it easier to focus on growth and its long-run effects. The
US during a recession is still a whole lot richer than India during a boom year.
Like income levels, income growth rates vary among countries. Differences in
average growth rates between countries will translate over time into differences in
countries’ relative levels of income.
Data between 1820 and 1960 is sketchier because less information collected and
shifting of borders (decolonization and conquest) examine data on groups of
countries. Results: Gap has widened between the rich and the poor and the relative
positions of country groups changed.
Before 1820 there is less information Forming an estimate of the standard of living
and comparing it among countries requires combining historical records, reports from
travellers and the Spanish conquistadors and even the examination of skeletal
remains.
Before 1820, growth was slow. Before 1500 no trend in growth, but does not mean
that living standards were constant. Income differences among countries were very
small by modern standards, less inequality among countries.
Inequality in the world result of within-country inequality and between country
inequality.
Chapter 2 – A Framework for Analysis
Differences between countries appear because of
- Lower rate of savings/Investment
o Difference in capital comes from the amount of investment.
Investment in new capital must represent saving by the citizens,
fraction of income saved matters most.
- Inferior technology
o Productivity = amount of output produced with each unit of capital.
Productivity depends on the available technology. Technology = the
available knowledge about how inputs can be combined to produce
output.
- Lower efficiency
o Efficiency = how the available technology and inputs into production
are used in producing output
Fundamentals
- Culture
- Economic policies (taxes, tariffs and regulations, property rights)
- Geography (natural resources, climate, world market)
Proximate cause = an event that is immediately responsible for causing some
observed result.
Ultimate cause = something that affects an observed result through a chain of
intermediate events.
Factors of production = inputs used for productions that a country can accumulate.
(amount of inputs available)
,Production function = mathematical description of how the inputs a firm are
transformed into its output
If countries have the same fundamentals, we can expect the country with a lower
level of income to grow faster. (above or below the income expected by the
fundamentals. Fast growth seems to be a reward for having a bad policy in the past.
Economic models = simplified representations of reality that can be used to analyze
how economic variables are determined.
Data is often not measured, bias and always observational instead of experimental.
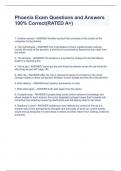
Scatter plot = each observation is represented by a single point. One variable is
measured along the horizontal axis, and one variable is measured along the vertical
axis. Allows to see the overall relationship between de variables.
Outliers = the observations that are inconsistent
Correlation = describes the degree to which two variables tend to move together.
High values for both variables positive correlated. High value correlated with low
value negative correlated
- Correlation coefficient = the degree of correlation between two variables,
between -1 and 1.
Three possible explanations for the correlation
1. X causes Y
2. Y causes X
o Reverse causation = One might think that X causes Y when in fact
the opposite is true
o Sum of x-x(mean) and y-y(mean) divided by the square root of the sum of x-
2 2
x(mean) and the square root of the sum of y-y(mean)
3. No direct causal relationship
o Omitted variable = third variable causes X and Y
o correlation between jellyfish stings and the amount of cold drinks
consumed. But is clear that jellyfish stings do not causes the
consumption of cold drinks and vice versa. Both variables are
caused by the weather.
Cross-sectional data = observations of different units at a single point in time
Problems with historical data
- Two things happened at the same time, not know who caused which or
they related
- Provides only one data point
Chapter 3 – Physical Capital
Capital = the physical objects that extend our ability or do work for us. Includes
machines, infrastructure, vehicles and computers.
More capital per worker means more output.
, Capital is
- Productive
- Produced
o Investment = the process of producing capital. Tradeoff between
investment and consumption
- Limited/rival
- Can earn return
o Incentive for its creation
- Wears out = Deprecation
Production function = Y = F(K,L)
Assumptions:
- Two separate factors of production (K,L)
- Productivity is parameter (A) assumed to be constant
- Constant return to scale = output grows with the same factor of input
o 2(K,L) implies 2Y
- Diminishing marginal product = extra output produced when one more
unit is of the input is used in production will be smaller.
o MPK = f(k+1) – f(k)
Cobb-Douglas production function F(K,L) = AKαL1 – α
A = technology
α = how capital and labor combine to produce output (0.35)
Per worker y = Akα k = K/L
Capital’s share of income = fraction of national income that is paid out as rent on
capital. (MPK x K)/Y = α 1/3 = α
Measuring change over time by the difference or looking at its growth rate (N-O/O)
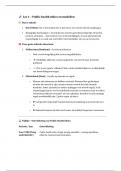
Solow model
Assumptions: Labor is constant over time, no improvement in productivity
Output per worker = y = f(k)
Investment per worker = γf(k) with γ is investment rate
Deprecation per worker = δk with δ as deprecation rate
Δk = yf(k) – δk
- investment = deprecation steady state
Steady state = amount of capital per
worker will not change over time.
- Investment > deprecation change in
capital stock positive and will grow, thus
below steady state
- Investment < deprecation change in
capital stock is negative and will reduce,
thus above steady state
Chapter 1 - The Facts to be Explained
Differences in people’s living standards are striking. In the last two centuries there is
a explosion of economic growth. But growth of income has been uneven. After World
War II, the average rate of growth of world income increased, but some parts of the
world failed to grow.
GDP = Gross Domestic Product = measure of the value of all of the goods and
services produced in a country in a year (national income)
- value of output produced in a country
- total income; wages, rents, interest, and profits
PPP = Purchasing power parity = based on the prices of a standardized basket of
goods and services, both traded and non-traded good.
Measure GDP with other sources of data to be sure.
- Amount of light that is visible at night from outer space
- HDI = Human Development Index
- Happiness
Problems GDP:
- exchange rate fluctuate daily
- only traded goods (price ratio differs in non-traded goods)
Using PPP exchange rates gives a more accurate picture.
With a standardized basket of goods and services, it is easy to determine how much
wage you need for the basket in each country. Because of the difference in price
level between countries, you should need more wage in a country with a high price
level to obtain the basket and less wage in a country with a low price level to obtain
the same basket.
20% of world population that lives in the richest countries receives 60% of world
income.
Growth rates of income = how quickly their income per capita is rising.
Growth is important because a country that grows faster will move to a higher level of
income over time
Ratio scale = equal spaces on the vertical axis correspond to equal proportional
differences in the variable being graphed
Rule of 72 = formula estimating the amount of time it takes something growing at a
given rate to double = 72/g
growth rate = Xt+1 – Xt / Xt g = (Xt+n/Xt)1/n – 1
Xt+n = Xt * (1+g)n
Growth is a long-run phenomenon. USA (Great Depression, World War II and
recession of 1974, 1982, 2018). Japan (End of World War II and 1973).
,Comparing countries makes it easier to focus on growth and its long-run effects. The
US during a recession is still a whole lot richer than India during a boom year.
Like income levels, income growth rates vary among countries. Differences in
average growth rates between countries will translate over time into differences in
countries’ relative levels of income.
Data between 1820 and 1960 is sketchier because less information collected and
shifting of borders (decolonization and conquest) examine data on groups of
countries. Results: Gap has widened between the rich and the poor and the relative
positions of country groups changed.
Before 1820 there is less information Forming an estimate of the standard of living
and comparing it among countries requires combining historical records, reports from
travellers and the Spanish conquistadors and even the examination of skeletal
remains.
Before 1820, growth was slow. Before 1500 no trend in growth, but does not mean
that living standards were constant. Income differences among countries were very
small by modern standards, less inequality among countries.
Inequality in the world result of within-country inequality and between country
inequality.
Chapter 2 – A Framework for Analysis
Differences between countries appear because of
- Lower rate of savings/Investment
o Difference in capital comes from the amount of investment.
Investment in new capital must represent saving by the citizens,
fraction of income saved matters most.
- Inferior technology
o Productivity = amount of output produced with each unit of capital.
Productivity depends on the available technology. Technology = the
available knowledge about how inputs can be combined to produce
output.
- Lower efficiency
o Efficiency = how the available technology and inputs into production
are used in producing output
Fundamentals
- Culture
- Economic policies (taxes, tariffs and regulations, property rights)
- Geography (natural resources, climate, world market)
Proximate cause = an event that is immediately responsible for causing some
observed result.
Ultimate cause = something that affects an observed result through a chain of
intermediate events.
Factors of production = inputs used for productions that a country can accumulate.
(amount of inputs available)
,Production function = mathematical description of how the inputs a firm are
transformed into its output
If countries have the same fundamentals, we can expect the country with a lower
level of income to grow faster. (above or below the income expected by the
fundamentals. Fast growth seems to be a reward for having a bad policy in the past.
Economic models = simplified representations of reality that can be used to analyze
how economic variables are determined.
Data is often not measured, bias and always observational instead of experimental.
Scatter plot = each observation is represented by a single point. One variable is
measured along the horizontal axis, and one variable is measured along the vertical
axis. Allows to see the overall relationship between de variables.
Outliers = the observations that are inconsistent
Correlation = describes the degree to which two variables tend to move together.
High values for both variables positive correlated. High value correlated with low
value negative correlated
- Correlation coefficient = the degree of correlation between two variables,
between -1 and 1.
Three possible explanations for the correlation
1. X causes Y
2. Y causes X
o Reverse causation = One might think that X causes Y when in fact
the opposite is true
o Sum of x-x(mean) and y-y(mean) divided by the square root of the sum of x-
2 2
x(mean) and the square root of the sum of y-y(mean)
3. No direct causal relationship
o Omitted variable = third variable causes X and Y
o correlation between jellyfish stings and the amount of cold drinks
consumed. But is clear that jellyfish stings do not causes the
consumption of cold drinks and vice versa. Both variables are
caused by the weather.
Cross-sectional data = observations of different units at a single point in time
Problems with historical data
- Two things happened at the same time, not know who caused which or
they related
- Provides only one data point
Chapter 3 – Physical Capital
Capital = the physical objects that extend our ability or do work for us. Includes
machines, infrastructure, vehicles and computers.
More capital per worker means more output.
, Capital is
- Productive
- Produced
o Investment = the process of producing capital. Tradeoff between
investment and consumption
- Limited/rival
- Can earn return
o Incentive for its creation
- Wears out = Deprecation
Production function = Y = F(K,L)
Assumptions:
- Two separate factors of production (K,L)
- Productivity is parameter (A) assumed to be constant
- Constant return to scale = output grows with the same factor of input
o 2(K,L) implies 2Y
- Diminishing marginal product = extra output produced when one more
unit is of the input is used in production will be smaller.
o MPK = f(k+1) – f(k)
Cobb-Douglas production function F(K,L) = AKαL1 – α
A = technology
α = how capital and labor combine to produce output (0.35)
Per worker y = Akα k = K/L
Capital’s share of income = fraction of national income that is paid out as rent on
capital. (MPK x K)/Y = α 1/3 = α
Measuring change over time by the difference or looking at its growth rate (N-O/O)
Solow model
Assumptions: Labor is constant over time, no improvement in productivity
Output per worker = y = f(k)
Investment per worker = γf(k) with γ is investment rate
Deprecation per worker = δk with δ as deprecation rate
Δk = yf(k) – δk
- investment = deprecation steady state
Steady state = amount of capital per
worker will not change over time.
- Investment > deprecation change in
capital stock positive and will grow, thus
below steady state
- Investment < deprecation change in
capital stock is negative and will reduce,
thus above steady state