Practice Exam course 2.5 Psychometrics
Question 1
Lisa has done a reliability test via SPSS (Crohnbach's alpha) and checked the box where the
reliability is shown when a certain item is removed. The reliability is .679. Item 1 "if deleted"
indicates a confidence level of .600. Does this item have a positive effect on reliability?
A. Yes, it indicates that the reliability decreases if this item is removed.
B. No, it indicates that the reliability increases when this item is removed.
C. Yes, it indicates that the reliability increases when this item is removed.
D. No, it indicates that the reliability decreases if this item is removed.
Question 2
Lisa takes the same test again and sees that the reliability increases when item 3 is removed.
Is it smart to delete this item immediately?
A. Yes, the reliability of the test will then be higher.
B. Yes, the test says this item does not fit so it is better to remove it.
C. No, you also have to take the validity of a test into account.
D. No, you may never delete items.
Question 3
Is a reliability of .679 enough for scientific research with a group of participants?
A. Yes, it requires a minimum reliability of .5
B. No, scientific research has very high standards and wants at least a reliability of .9
C. Yes, as long as the reliability is above 0, it is enough for scientific research.
D. No, a minimum reliability of .7 is needed.
Lara de Jong
,Question 4
See the dataset below.
How many factors would you assume if you only looked at the Eigenvalues?
A. 1
B. 3
C. 4
D. 7
Question 5
When you look at the dataset given in question 4, how many factors would you assume if you
looked at the % of variance?
A. 1 or 2
B. 2 or 3
C. 4 or 5
D. 7 or 8
Lara de Jong
, Question 6
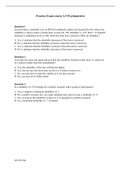
Below you see a scree plot. How many factors would you assume based on this plot?
A. 1 or 3
B. 2
C. 4
D. 7
Question 7
What does a pattern matrix represent?
A. This shows the covariance of two items.
B. This shows the correlation between the items and the factor after rotation.
C. This shows the factor loading and overlap of each item.
D. This shows the only contribution of the factor in explaining the variance in the item.
Question 8
What is the difference between validity and reliability?
A. Reliability shows the correlation between items. Validity shows the covariance of items.
B. Validity shows the correlation between items. Reliability shows the covariance of items.
C. Reliability is the consistency and repetition of your measurements. Validity is that you
measure what you want to measure.
D. Validity is the consistency and repetition of your measurements. Reliability means that you
measure what you want to measure.
Lara de Jong
Question 1
Lisa has done a reliability test via SPSS (Crohnbach's alpha) and checked the box where the
reliability is shown when a certain item is removed. The reliability is .679. Item 1 "if deleted"
indicates a confidence level of .600. Does this item have a positive effect on reliability?
A. Yes, it indicates that the reliability decreases if this item is removed.
B. No, it indicates that the reliability increases when this item is removed.
C. Yes, it indicates that the reliability increases when this item is removed.
D. No, it indicates that the reliability decreases if this item is removed.
Question 2
Lisa takes the same test again and sees that the reliability increases when item 3 is removed.
Is it smart to delete this item immediately?
A. Yes, the reliability of the test will then be higher.
B. Yes, the test says this item does not fit so it is better to remove it.
C. No, you also have to take the validity of a test into account.
D. No, you may never delete items.
Question 3
Is a reliability of .679 enough for scientific research with a group of participants?
A. Yes, it requires a minimum reliability of .5
B. No, scientific research has very high standards and wants at least a reliability of .9
C. Yes, as long as the reliability is above 0, it is enough for scientific research.
D. No, a minimum reliability of .7 is needed.
Lara de Jong
,Question 4
See the dataset below.
How many factors would you assume if you only looked at the Eigenvalues?
A. 1
B. 3
C. 4
D. 7
Question 5
When you look at the dataset given in question 4, how many factors would you assume if you
looked at the % of variance?
A. 1 or 2
B. 2 or 3
C. 4 or 5
D. 7 or 8
Lara de Jong
, Question 6
Below you see a scree plot. How many factors would you assume based on this plot?
A. 1 or 3
B. 2
C. 4
D. 7
Question 7
What does a pattern matrix represent?
A. This shows the covariance of two items.
B. This shows the correlation between the items and the factor after rotation.
C. This shows the factor loading and overlap of each item.
D. This shows the only contribution of the factor in explaining the variance in the item.
Question 8
What is the difference between validity and reliability?
A. Reliability shows the correlation between items. Validity shows the covariance of items.
B. Validity shows the correlation between items. Reliability shows the covariance of items.
C. Reliability is the consistency and repetition of your measurements. Validity is that you
measure what you want to measure.
D. Validity is the consistency and repetition of your measurements. Reliability means that you
measure what you want to measure.
Lara de Jong