Qualitative and Quantitative research methods in the Social Sciences YSS20306
Learning outcomes
- Explain techniques
- Apply techniques
- Appraise results from techniques
→ BS offline after July so download all the material I need
4 closed questions per technique (4x4) → all correct = grade 4.5
The rest is open questions
20 closed questions for qualitative
Learning outcomes
- Explain and exemplify the goals, background, and some principles of three quantitative data-
analysis techniques (regression analysis, analysis of variance, and principal components and
common factor analysis);
- Apply these three techniques to analyse data from studies in the social sciences (using the
computer program SPSS) and appraise the results they produce;
- Select the appropriate technique out of these three, given typical research questions; explain and
exemplify the theoretical principles of qualitative research;
- Set up a qualitative research design in which a practical problem is worked out into research
questions and a data-collection plan;
- Design an interview guide and observation plan and carry out data collection for qualitative
research by means of both interviews and observations;
- Code textual material for further analysis;
- Discuss the relation between data collection and data analysis in qualitative research;
- Appraise the complimentary nature of quantitative and qualitative research techniques.
1
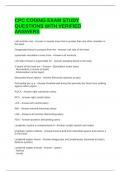
,Quantitative research techniques
= delta = difference
→ H0: mean of L = mean of G (no
difference)
Streep op letter = mean
→ Sample mean is estimate of mean in
population = hoedje op letter
N = 50 + 26 – 2 (df) = 74
H0 = value 0, so is Ha higher/ lower/
higher or lower than H0 → answer =
higher
Answer = Right sided p value
→ Outcome of TS is in direction of Ha,
devide 2-sided p value (0,000053) by
two → answer = 0,000027
→ Prediction, if we do the study
repeatedly, in 95% of the samples, the
difference in mean would be in
between 1,65 and 4,50
→ for T-test = Cohen’s d
2
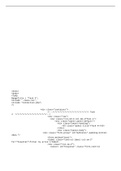
,Which assumptions should hold, such that calculated t-values indeed follow Student’s t-distribution under H0?
Answer:
- Scores are normally distributed within the groups = t distribution
- Scores can be assumed to be interval-scaled = doesn’t work on nominal of ordinal scale!
- Equal within-group variances (homogeneity) = variation should be the same as another group
- Independent observation = one observation should not influence the other one
Practice questions:
- Number of observation units: survey < experiment < case study
- Standardized data collection method: survey + experiment
Unstandardized/ adaptive data collection method: case study
- Reliability: replications of a study (under similar conditions) give pretty much the same results
3
, Lecture 2
Techniques in this course:
1. Basic statistics
2. Correlation
2. Simple regression
3. Multiple regression
4. Oneway analysis of variance
5. Factorial analysis of variance
6. Exploratory factor analysis
Dependence techniques
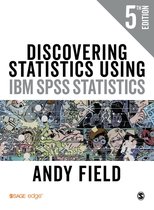
Regression analysis example in slide!
- Record sales/ career members = outcomes, criterian variables, dependent
- Attractiveness of band, advertising budget = predictors, independent
→ Predicting scores, or looking for a causal effect
→ red = oucome, blue = predictor
→ Outcomes are a function of predictors
→ Important criteria
WC: When is a variable measured on an interval scale? → ratios of differences between scores are meaningful
Different specific techniques, depending on predictors
Predictor on interval scale, only one predictor (next week; more predictors = multiple regression)
Levels: Nominal → ordinal → interval → ratio
Interdependence techniques
- Investigate interrelations among a number of variables x (e.g. questions about ‘difficulty with mathematics’ and
‘fear for statistics’
- No distinction between outcome and predictor variables
Different specific techniques, depending on variables
‘interval or higher’ = interval of ratio
4
Learning outcomes
- Explain techniques
- Apply techniques
- Appraise results from techniques
→ BS offline after July so download all the material I need
4 closed questions per technique (4x4) → all correct = grade 4.5
The rest is open questions
20 closed questions for qualitative
Learning outcomes
- Explain and exemplify the goals, background, and some principles of three quantitative data-
analysis techniques (regression analysis, analysis of variance, and principal components and
common factor analysis);
- Apply these three techniques to analyse data from studies in the social sciences (using the
computer program SPSS) and appraise the results they produce;
- Select the appropriate technique out of these three, given typical research questions; explain and
exemplify the theoretical principles of qualitative research;
- Set up a qualitative research design in which a practical problem is worked out into research
questions and a data-collection plan;
- Design an interview guide and observation plan and carry out data collection for qualitative
research by means of both interviews and observations;
- Code textual material for further analysis;
- Discuss the relation between data collection and data analysis in qualitative research;
- Appraise the complimentary nature of quantitative and qualitative research techniques.
1
,Quantitative research techniques
= delta = difference
→ H0: mean of L = mean of G (no
difference)
Streep op letter = mean
→ Sample mean is estimate of mean in
population = hoedje op letter
N = 50 + 26 – 2 (df) = 74
H0 = value 0, so is Ha higher/ lower/
higher or lower than H0 → answer =
higher
Answer = Right sided p value
→ Outcome of TS is in direction of Ha,
devide 2-sided p value (0,000053) by
two → answer = 0,000027
→ Prediction, if we do the study
repeatedly, in 95% of the samples, the
difference in mean would be in
between 1,65 and 4,50
→ for T-test = Cohen’s d
2
,Which assumptions should hold, such that calculated t-values indeed follow Student’s t-distribution under H0?
Answer:
- Scores are normally distributed within the groups = t distribution
- Scores can be assumed to be interval-scaled = doesn’t work on nominal of ordinal scale!
- Equal within-group variances (homogeneity) = variation should be the same as another group
- Independent observation = one observation should not influence the other one
Practice questions:
- Number of observation units: survey < experiment < case study
- Standardized data collection method: survey + experiment
Unstandardized/ adaptive data collection method: case study
- Reliability: replications of a study (under similar conditions) give pretty much the same results
3
, Lecture 2
Techniques in this course:
1. Basic statistics
2. Correlation
2. Simple regression
3. Multiple regression
4. Oneway analysis of variance
5. Factorial analysis of variance
6. Exploratory factor analysis
Dependence techniques
Regression analysis example in slide!
- Record sales/ career members = outcomes, criterian variables, dependent
- Attractiveness of band, advertising budget = predictors, independent
→ Predicting scores, or looking for a causal effect
→ red = oucome, blue = predictor
→ Outcomes are a function of predictors
→ Important criteria
WC: When is a variable measured on an interval scale? → ratios of differences between scores are meaningful
Different specific techniques, depending on predictors
Predictor on interval scale, only one predictor (next week; more predictors = multiple regression)
Levels: Nominal → ordinal → interval → ratio
Interdependence techniques
- Investigate interrelations among a number of variables x (e.g. questions about ‘difficulty with mathematics’ and
‘fear for statistics’
- No distinction between outcome and predictor variables
Different specific techniques, depending on variables
‘interval or higher’ = interval of ratio
4