Chapter 1: Introduction to Statistics
Definition of Statistics:
Def: a set of mathematical procedures for organizing, summarizing, and interpreting
information
- Statistics consist of facts and figures
- It refers to the general field of mathematics
They sever 2 general purposes:
1. Statistics are used to organize and summarize the information so that the researcher can
see what happened in the research study and can communicate the results to others.
2. Statistics help the researcher to answer the questions that initiated the research by
determining exactly what general conclusions are justified based on the specific results
that were obtained.
- Statistical procedures help ensure that the information or observation are presented
and interpreted in an accurate and informative way.
- It helps researchers bring order out of chaos
- It is ultimately concerned with trying to draw meaning from data
Populations and Samples:
Population
Def: = a set of all the individuals of interest in a particular study (entire group)
- Populations can vary in size form extremely large to very small, depending on how the
investigator defines the population
- Populations tend to be very large = usually is impossible for a researcher to examine
every individual in the population of interest
- Researchers typically select a smaller, more manageable group from the population and
limit their studies to the individuals in the selected group.
- In statistical terms, a set of individuals selected from a population is called a sample.
Sample
Def: is a set of individuals selected from a population, usually intended to represent the
population in a research study
- A sample is intended to be representative of its population, and a sample should always
be identified in terms of the population from which it was selected.
- Samples can vary in size
- A researcher studies a sample and then generalizes the results from the sample to the
population. This is done to answer the research question.
1
, Variable and data :
Variable
Def: A characteristic or condition that changes or has different values for different
individuals
- Can be characteristics that differ from one individual to another (ie: weight, gender, fast-
food preference, time of day, temperature, TV commercials)
- To demonstrate changes in variables, it is necessary to make measurements of the
variables being examined
Data
Def: Data (plural) are measurements or observations
A data set is a collection of measurement or observations
A datum (singular) is a single measurement or observation and is commonly called a
score or raw score.
Note: because research typically involves measuring each individual to obtain a score, every
sample (or population) of individuals produces a corresponding sample of scores.
Parameters and Statistics:
Parameter :
Def A value that describes a population (usually a numerical value)
- It is usually derived form measurements of the individuals in the population
- Eg: the average score of the population
Statistic:
Def: A value/characteristic that describes a sample
- It is usually derived from measurement of the individuals in the sample
Note: every population parameter has a corresponding sample statistic, and most research
studies involve using statistics from samples as the basis for answering questions about
population parameters.
Descriptive and Inferential Statistical Methods:
Descriptive Statistic:
Def: Statistical procedures used to summarize, organize and simplify data
- Descriptive statistics are techniques that take raw scores and organize or summarize
them in a form that is more manageable
- They are a vital first step in interpreting research data since describing data is always the
first step in any data-analysis method.
- Often the scores are organized in a table or a graph so that it is possible to see the entire
set of scores.
2
, - Alternatively, a set of scores are summarised by computing an average. No matter the
amount of scores, the average provides a single descriptive value for the entire set.
Inferential Statistics:
Def: Consist of techniques that allow us to study samples and then generalize about the
populations from which they were selected
- Populations are typically large = usually not possible to measure everyone in the
population = A sample is selected to represent the population
- researchers use sample statistics as the basis for drawing conclusions about population
parameters
- Problem with samples = provides limited information about the population
- There usually is some discrepancy between a sample statistic and the corresponding
population parameter
- This discrepancy is called sampling error, and it creates the fundamental problem that
inferential statistics must address.
Sampling Error:
Def: Is the naturally occurring discrepancy or error that exists between a sample statistic
and the corresponding population parameter
- Eg: the error associated with a sample proportion (Ie: in newspaper articles reporting
results from political polls, you frequently find statement such as “Brown lead the poll
with 51% of the vote. Smith has 42%.
- The margin of error is the same as the sampling error
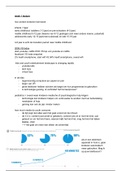
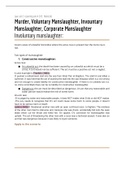
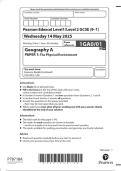
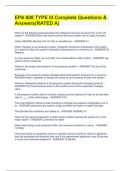
ABOVE: It shows an overview of a general research
situation and demonstrate the roles of descriptive
and inferential statistics play.
3
, Variables and Measurement:
- The scores that make up the data from a research study are the result of observing
and measuring variables.
Constructs and Operational Definitions:
Definitions:
Constructs: Internal attributes or characteristics that can’t be directly observed but are
useful for describing and explaining behaviour
Eg: intelligence, anxiety, hunger
Because they intangible and can’t be directly observed = hypothetical
constructs
Operational Identifies a measurement procedure (set of operations) for measuring an
Definition: external behaviour and uses the resulting measurements as a definition
and a measurement of a hypothetical construct
Has 2 components:
1. Describes a set of operations for measuring a construct
2. It defines the construct in terms of the resulting measurements
Eg: Your intelligence is measured and defined by your performance and an
IQ test // hunger can be measured and defined by the number of hours
since last eating
Discrete and Continuous Variables:
Discrete Variables
Def: Consists of separate, indivisible categories. No values can exist btwn 2 neighbouring
categories
- They are commonly restricted to whole, countable numbers
- Eg: the no. of children in a family or no. of students attending class
- It may also consist of observations that differ qualitatively
- Eg: ppl can be classified by birth order, occupation
Continuous Variables:
Def: Is divisible into an infinite no. of fractional parts
- Eg: time, height, and weight
- Continuous variable = pictured as a continuous line
Two factors that apply to continuous variables:
1. When measuring a continuous variable, it should be very rare to obtain identical
measurement for two different variables. Because a continuous variable has an infinite
number of possible values, it should be almost impossible for two people to have the
same score
4
Definition of Statistics:
Def: a set of mathematical procedures for organizing, summarizing, and interpreting
information
- Statistics consist of facts and figures
- It refers to the general field of mathematics
They sever 2 general purposes:
1. Statistics are used to organize and summarize the information so that the researcher can
see what happened in the research study and can communicate the results to others.
2. Statistics help the researcher to answer the questions that initiated the research by
determining exactly what general conclusions are justified based on the specific results
that were obtained.
- Statistical procedures help ensure that the information or observation are presented
and interpreted in an accurate and informative way.
- It helps researchers bring order out of chaos
- It is ultimately concerned with trying to draw meaning from data
Populations and Samples:
Population
Def: = a set of all the individuals of interest in a particular study (entire group)
- Populations can vary in size form extremely large to very small, depending on how the
investigator defines the population
- Populations tend to be very large = usually is impossible for a researcher to examine
every individual in the population of interest
- Researchers typically select a smaller, more manageable group from the population and
limit their studies to the individuals in the selected group.
- In statistical terms, a set of individuals selected from a population is called a sample.
Sample
Def: is a set of individuals selected from a population, usually intended to represent the
population in a research study
- A sample is intended to be representative of its population, and a sample should always
be identified in terms of the population from which it was selected.
- Samples can vary in size
- A researcher studies a sample and then generalizes the results from the sample to the
population. This is done to answer the research question.
1
, Variable and data :
Variable
Def: A characteristic or condition that changes or has different values for different
individuals
- Can be characteristics that differ from one individual to another (ie: weight, gender, fast-
food preference, time of day, temperature, TV commercials)
- To demonstrate changes in variables, it is necessary to make measurements of the
variables being examined
Data
Def: Data (plural) are measurements or observations
A data set is a collection of measurement or observations
A datum (singular) is a single measurement or observation and is commonly called a
score or raw score.
Note: because research typically involves measuring each individual to obtain a score, every
sample (or population) of individuals produces a corresponding sample of scores.
Parameters and Statistics:
Parameter :
Def A value that describes a population (usually a numerical value)
- It is usually derived form measurements of the individuals in the population
- Eg: the average score of the population
Statistic:
Def: A value/characteristic that describes a sample
- It is usually derived from measurement of the individuals in the sample
Note: every population parameter has a corresponding sample statistic, and most research
studies involve using statistics from samples as the basis for answering questions about
population parameters.
Descriptive and Inferential Statistical Methods:
Descriptive Statistic:
Def: Statistical procedures used to summarize, organize and simplify data
- Descriptive statistics are techniques that take raw scores and organize or summarize
them in a form that is more manageable
- They are a vital first step in interpreting research data since describing data is always the
first step in any data-analysis method.
- Often the scores are organized in a table or a graph so that it is possible to see the entire
set of scores.
2
, - Alternatively, a set of scores are summarised by computing an average. No matter the
amount of scores, the average provides a single descriptive value for the entire set.
Inferential Statistics:
Def: Consist of techniques that allow us to study samples and then generalize about the
populations from which they were selected
- Populations are typically large = usually not possible to measure everyone in the
population = A sample is selected to represent the population
- researchers use sample statistics as the basis for drawing conclusions about population
parameters
- Problem with samples = provides limited information about the population
- There usually is some discrepancy between a sample statistic and the corresponding
population parameter
- This discrepancy is called sampling error, and it creates the fundamental problem that
inferential statistics must address.
Sampling Error:
Def: Is the naturally occurring discrepancy or error that exists between a sample statistic
and the corresponding population parameter
- Eg: the error associated with a sample proportion (Ie: in newspaper articles reporting
results from political polls, you frequently find statement such as “Brown lead the poll
with 51% of the vote. Smith has 42%.
- The margin of error is the same as the sampling error
ABOVE: It shows an overview of a general research
situation and demonstrate the roles of descriptive
and inferential statistics play.
3
, Variables and Measurement:
- The scores that make up the data from a research study are the result of observing
and measuring variables.
Constructs and Operational Definitions:
Definitions:
Constructs: Internal attributes or characteristics that can’t be directly observed but are
useful for describing and explaining behaviour
Eg: intelligence, anxiety, hunger
Because they intangible and can’t be directly observed = hypothetical
constructs
Operational Identifies a measurement procedure (set of operations) for measuring an
Definition: external behaviour and uses the resulting measurements as a definition
and a measurement of a hypothetical construct
Has 2 components:
1. Describes a set of operations for measuring a construct
2. It defines the construct in terms of the resulting measurements
Eg: Your intelligence is measured and defined by your performance and an
IQ test // hunger can be measured and defined by the number of hours
since last eating
Discrete and Continuous Variables:
Discrete Variables
Def: Consists of separate, indivisible categories. No values can exist btwn 2 neighbouring
categories
- They are commonly restricted to whole, countable numbers
- Eg: the no. of children in a family or no. of students attending class
- It may also consist of observations that differ qualitatively
- Eg: ppl can be classified by birth order, occupation
Continuous Variables:
Def: Is divisible into an infinite no. of fractional parts
- Eg: time, height, and weight
- Continuous variable = pictured as a continuous line
Two factors that apply to continuous variables:
1. When measuring a continuous variable, it should be very rare to obtain identical
measurement for two different variables. Because a continuous variable has an infinite
number of possible values, it should be almost impossible for two people to have the
same score
4