Unit 13
After this unit, you will be able to...
differentiate between bivariate and univariate graphs and tables (and you know when to use what
kind of display);
create a scatterplot (using statistical software and by hand) with the independent variable on the X-
axis and the dependent variable on the Y-axis;
create a contingency table (using statistical software and by hand) with the independent variable in
the columns, the dependent variables in the rows, and column percentages in the cells;
interpret results that are displayed in scatterplots and contingency tables.
Key terms:
Bivariate analysis
Contingency table
Scatterplot
Regression line
Strength (of a bivariate relationship)
Direction (of a bivariate relationship)
Linear relationship
Categorical variables- nominal, dichotomous, or ordinal
Quantitative variables (numerical)- interval and ratio
1. Bivariate analysis- Bivariate analysis is one of the simplest forms of quantitative analysis. It
involves the analysis of two variables, for the purpose of determining the empirical
relationship between them. Bivariate analysis can be helpful in testing simple hypotheses of
association
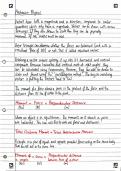
2. Contingency table- enables you to display
the relationship between two categorical
(ordinal or nominal variables). It is similar
to a frequency table, but the main
difference is that the frequency table
always concerns only one variable. The
contingency table concerns two variables.
The table on the right shows the absolute numbers of the values.
, - Column percentages= (cell/total (column))x 100- how to present the numbers in
percentages (total 100%)
- Proportions- how to present percentages into conditional proportions 38%=0.38,
45%=0.45, etc (total 1.0). The proportions are called ‘conditional proportions’ because
they are formed under the condition of another variable
- Marginal proportions- use the count in the margin of the table (cell/total column)
3. Scatterplot- displays the relationship between two
quantitative variables. A scatterplot displays the
strength, direction, and form of the relationship
between two quantitative variables
- Independent variable- x-axis
- Dependent variable- y-axis
a) How to describe a scatterplot
- Form: Is the association linear or nonlinear?
- Direction: Is the association positive or negative?
- Strength: Does the association appear to be strong, moderately strong, or weak?
- Outliers: Do there appear to be any data points that are unusually far away from the
general pattern?
4. Regression line- A regression line can be used to predict the value of y for a given value of x.
5. Linear relationship- A linear relationship (or
linear association) is a statistical term used to
describe a straight-line relationship between two
variables.
6. Non- linear relationship- Nonlinearity is a term
used in statistics to describe a situation where there is not a
straight-line or direct relationship between an independent
variable and a dependent variable
7. Types of correlation in scatterplots:
- positive (values increase together),
- negative (one value decreases as the other increases)- an
inrcrease of the x-axis is associated with a decrease of the y-
axis
- null (no correlation),
- linear
- xponential
- U-shaped (curvilinear)
,8. Strength of a bivariate relationship-The strength of the
correlation can be determined by how closely packed the points
are to each other on the graph.
a) A correlation coefficient measures the strength of that
relationship
- Strong- if there aren’t many outliers on the linear
relationship. The strongest linear relationship occurs when
the slope is 1. This means that when one variable increases
by one, the other variable also increases by the same amount. This line is at a 45 degree
angle
- Weak- if there are a lot of outliers on the linear relationship
NOTE: If there are cases in weak linear relationships that are far from the line, they are
outliers
b) Way to measure a linear correlation- thorugh Pearson correlation coefficient:
- Values always range between -1 (strong negative relationship) and +1 (strong positive
relationship)
,
After this unit, you will be able to...
differentiate between bivariate and univariate graphs and tables (and you know when to use what
kind of display);
create a scatterplot (using statistical software and by hand) with the independent variable on the X-
axis and the dependent variable on the Y-axis;
create a contingency table (using statistical software and by hand) with the independent variable in
the columns, the dependent variables in the rows, and column percentages in the cells;
interpret results that are displayed in scatterplots and contingency tables.
Key terms:
Bivariate analysis
Contingency table
Scatterplot
Regression line
Strength (of a bivariate relationship)
Direction (of a bivariate relationship)
Linear relationship
Categorical variables- nominal, dichotomous, or ordinal
Quantitative variables (numerical)- interval and ratio
1. Bivariate analysis- Bivariate analysis is one of the simplest forms of quantitative analysis. It
involves the analysis of two variables, for the purpose of determining the empirical
relationship between them. Bivariate analysis can be helpful in testing simple hypotheses of
association
2. Contingency table- enables you to display
the relationship between two categorical
(ordinal or nominal variables). It is similar
to a frequency table, but the main
difference is that the frequency table
always concerns only one variable. The
contingency table concerns two variables.
The table on the right shows the absolute numbers of the values.
, - Column percentages= (cell/total (column))x 100- how to present the numbers in
percentages (total 100%)
- Proportions- how to present percentages into conditional proportions 38%=0.38,
45%=0.45, etc (total 1.0). The proportions are called ‘conditional proportions’ because
they are formed under the condition of another variable
- Marginal proportions- use the count in the margin of the table (cell/total column)
3. Scatterplot- displays the relationship between two
quantitative variables. A scatterplot displays the
strength, direction, and form of the relationship
between two quantitative variables
- Independent variable- x-axis
- Dependent variable- y-axis
a) How to describe a scatterplot
- Form: Is the association linear or nonlinear?
- Direction: Is the association positive or negative?
- Strength: Does the association appear to be strong, moderately strong, or weak?
- Outliers: Do there appear to be any data points that are unusually far away from the
general pattern?
4. Regression line- A regression line can be used to predict the value of y for a given value of x.
5. Linear relationship- A linear relationship (or
linear association) is a statistical term used to
describe a straight-line relationship between two
variables.
6. Non- linear relationship- Nonlinearity is a term
used in statistics to describe a situation where there is not a
straight-line or direct relationship between an independent
variable and a dependent variable
7. Types of correlation in scatterplots:
- positive (values increase together),
- negative (one value decreases as the other increases)- an
inrcrease of the x-axis is associated with a decrease of the y-
axis
- null (no correlation),
- linear
- xponential
- U-shaped (curvilinear)
,8. Strength of a bivariate relationship-The strength of the
correlation can be determined by how closely packed the points
are to each other on the graph.
a) A correlation coefficient measures the strength of that
relationship
- Strong- if there aren’t many outliers on the linear
relationship. The strongest linear relationship occurs when
the slope is 1. This means that when one variable increases
by one, the other variable also increases by the same amount. This line is at a 45 degree
angle
- Weak- if there are a lot of outliers on the linear relationship
NOTE: If there are cases in weak linear relationships that are far from the line, they are
outliers
b) Way to measure a linear correlation- thorugh Pearson correlation coefficient:
- Values always range between -1 (strong negative relationship) and +1 (strong positive
relationship)
,