Psychology 253
Student Summaries
,Week 1 Introduction to Statistics & Frequency Distributions
What should I do this week? (21-25 September)
This week, we will start with an Introductory podcast by Dr Roomaney. The aim of this podcast is to orientate
you to the module. The podcast contains information about lectures, assessments, the textbook, and tutorials.
This is followed by five podcasts by Ms Witten on:
1) Scales of measurement
2) Data structures
3) Frequency tables and distributions
4) Grouped frequency tables
5) The shape of distributions
You are expected to do the following:
1) Study the Module Framework
2) Take note of all upcoming Test and Exam Dates
3) Familiarise yourself with the SUNLearn page
4) Study chapters 1 (Introduction to statistics) and 2 (Frequency distributions) in the textbook.
5) Read through the PowerPoint slides and study the podcasts
6) Remember to sign up for a tutorial group my Monday 21 September (tutorials are optional).
7) All students have access to the tutorial exercises and abbreviated memos (these memos do not indicate the
full calculations). This week’s tutorial will be self-study because the allocation of tutorial groups is still to be
finalised.
8) Remember that you can post your questions about this week's content on the week's discussion forum
below anytime.
Why study quantitative data analysis in psychology?
Statistics allow us to make sense of and interpret data, stats allow us to hypothesis
Understand psychological phenomena such as depression, anxiety, memory etc
To determine the prevalence of things/ how common depression is
Useful when trying to compare prevalence’s, levels of depression amongst students in different
faculties
Relationships between variables, sleep and memory, test research by performing correlations
Test efficacy of interventions
Use statistics to decide could work in clinical practice, what to avoid if costly or unnecessary
Podcasts cover key content, one concept each, short, more difficult as weeks progress, so stay up to
date
Read textbook chapters and practice in tutorials, ask for assistance for challenging calculations
Tests
14 October Online, 50 marks, 60 minutes, true and false questions and mcq, easy calculation or
theory (1 mark), other mcq more calculations (2 or more marks), bring in own formula sheets and
unit normal tables, copies available before test to print, need calculator
Exam, 100 marks, 120 minutes, mcq, theory and calculations, all chapters in module
,Week 1: Scales of Measurement
Four important scales of measurement
Measurements of our observations, involves assigns individuals or events to
categories
The categories can be places or names, such as male/female or
employed/unemployed
They can be numerical values, such as 68 inches or 175 pounds
Used to measure a variable which makes up a scale of measurement, relationships
between determine the different types of scales
The complete set of categories makes up a scale of measurement
Relationships between the categories determine different types of scales
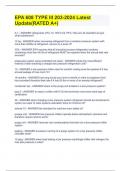
Scale Characteristics Examples
Nominal •Label and categorize •Gender
•No quantitative distinctions •Diagnosis
•Experimental or Control
Ordinal •Categorizes observations •Rank in class
•Categories organized by size or magnitude •Clothing sizes (S, M,
L,XL)
•Olympic medals
Interval •Ordered categories •Temperature
•Interval between categories of equal •IQ
size •Golf scores
•Arbitrary or absent zero point (above/below par)
Ratio •Ordered categories •Number of correct
•Equal interval between answers
categories •Time to complete task
•Absolute zero point •Gain in height since last
year
Nominal involves labels, classifying events or names in categories, may not or aren’t
related in any way e.g. majors such as psychology or biology
Ordinal consists of categories organised in a sequence e.g. class, clothing sizes,
academic achievement, ordered sequence means that there is relationship between
the categories for example someone came first or second in the category
Interval scale consist of ordered categories that are intervals of the same size, the
difference between the two values are meaningful e.g. person a 65% and person B
scored 85%, so 15% more, the zero point is arbitrary so this means there is no zero
Ratio scale, interval scale with added characteristics so it has an absolute zero. So, it
has everything the interval scale except that it does have a zero point. Score of zero
equals none, any amount of correct answers or nothing at all so you can score a zero
there
, Week 1: Data Structures, Research Methods and Statistics
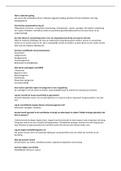
Data Structure I: Descriptive research (individual variables)
One (or more) separate variables are measured per individual
“Statistics” describe the observed variable, intention is to describe
May use category and/or numerical variables
Table speaks to how many hours an individual exercises, sleeps, studies. Simply
describing the variables, different for each person
Relationships between variables
Most research aims to examine if there is a r.s between variables e.g. number of
hours between studying and test results
First need to make observations
Two (or more) variables observed and measured
One of two possible data structures used to determine what type of relationship
exists
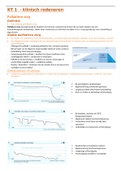
Data Structure II: The correlational method
One group of participants, two variables for each individual
Measurement of two variables for each participant
Goal is to describe type and magnitude of the relationship
Patterns in the data reveal relationships
Non-experimental method of study
Example shows info on four students and number of hours on social media has a r.s
between results
Student Summaries
,Week 1 Introduction to Statistics & Frequency Distributions
What should I do this week? (21-25 September)
This week, we will start with an Introductory podcast by Dr Roomaney. The aim of this podcast is to orientate
you to the module. The podcast contains information about lectures, assessments, the textbook, and tutorials.
This is followed by five podcasts by Ms Witten on:
1) Scales of measurement
2) Data structures
3) Frequency tables and distributions
4) Grouped frequency tables
5) The shape of distributions
You are expected to do the following:
1) Study the Module Framework
2) Take note of all upcoming Test and Exam Dates
3) Familiarise yourself with the SUNLearn page
4) Study chapters 1 (Introduction to statistics) and 2 (Frequency distributions) in the textbook.
5) Read through the PowerPoint slides and study the podcasts
6) Remember to sign up for a tutorial group my Monday 21 September (tutorials are optional).
7) All students have access to the tutorial exercises and abbreviated memos (these memos do not indicate the
full calculations). This week’s tutorial will be self-study because the allocation of tutorial groups is still to be
finalised.
8) Remember that you can post your questions about this week's content on the week's discussion forum
below anytime.
Why study quantitative data analysis in psychology?
Statistics allow us to make sense of and interpret data, stats allow us to hypothesis
Understand psychological phenomena such as depression, anxiety, memory etc
To determine the prevalence of things/ how common depression is
Useful when trying to compare prevalence’s, levels of depression amongst students in different
faculties
Relationships between variables, sleep and memory, test research by performing correlations
Test efficacy of interventions
Use statistics to decide could work in clinical practice, what to avoid if costly or unnecessary
Podcasts cover key content, one concept each, short, more difficult as weeks progress, so stay up to
date
Read textbook chapters and practice in tutorials, ask for assistance for challenging calculations
Tests
14 October Online, 50 marks, 60 minutes, true and false questions and mcq, easy calculation or
theory (1 mark), other mcq more calculations (2 or more marks), bring in own formula sheets and
unit normal tables, copies available before test to print, need calculator
Exam, 100 marks, 120 minutes, mcq, theory and calculations, all chapters in module
,Week 1: Scales of Measurement
Four important scales of measurement
Measurements of our observations, involves assigns individuals or events to
categories
The categories can be places or names, such as male/female or
employed/unemployed
They can be numerical values, such as 68 inches or 175 pounds
Used to measure a variable which makes up a scale of measurement, relationships
between determine the different types of scales
The complete set of categories makes up a scale of measurement
Relationships between the categories determine different types of scales
Scale Characteristics Examples
Nominal •Label and categorize •Gender
•No quantitative distinctions •Diagnosis
•Experimental or Control
Ordinal •Categorizes observations •Rank in class
•Categories organized by size or magnitude •Clothing sizes (S, M,
L,XL)
•Olympic medals
Interval •Ordered categories •Temperature
•Interval between categories of equal •IQ
size •Golf scores
•Arbitrary or absent zero point (above/below par)
Ratio •Ordered categories •Number of correct
•Equal interval between answers
categories •Time to complete task
•Absolute zero point •Gain in height since last
year
Nominal involves labels, classifying events or names in categories, may not or aren’t
related in any way e.g. majors such as psychology or biology
Ordinal consists of categories organised in a sequence e.g. class, clothing sizes,
academic achievement, ordered sequence means that there is relationship between
the categories for example someone came first or second in the category
Interval scale consist of ordered categories that are intervals of the same size, the
difference between the two values are meaningful e.g. person a 65% and person B
scored 85%, so 15% more, the zero point is arbitrary so this means there is no zero
Ratio scale, interval scale with added characteristics so it has an absolute zero. So, it
has everything the interval scale except that it does have a zero point. Score of zero
equals none, any amount of correct answers or nothing at all so you can score a zero
there
, Week 1: Data Structures, Research Methods and Statistics
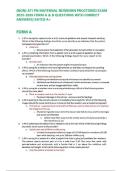
Data Structure I: Descriptive research (individual variables)
One (or more) separate variables are measured per individual
“Statistics” describe the observed variable, intention is to describe
May use category and/or numerical variables
Table speaks to how many hours an individual exercises, sleeps, studies. Simply
describing the variables, different for each person
Relationships between variables
Most research aims to examine if there is a r.s between variables e.g. number of
hours between studying and test results
First need to make observations
Two (or more) variables observed and measured
One of two possible data structures used to determine what type of relationship
exists
Data Structure II: The correlational method
One group of participants, two variables for each individual
Measurement of two variables for each participant
Goal is to describe type and magnitude of the relationship
Patterns in the data reveal relationships
Non-experimental method of study
Example shows info on four students and number of hours on social media has a r.s
between results