ME20026: PROJECT MANAGEMENT: ME20026: PROJECT MANAGEMENT
PROJECT CONTROLS: NETWORK DIAGRAMS:
Definition: Used to show interdependency logic of a project in order to perform CPA and PERT
Techniques to ensure that a project is completed on Types of diagrams
time and within budget o Activity-on-Arrow
Nb a project is a temporary endeavour undertaken o Activity-on-Node
to create a unique product, service or result
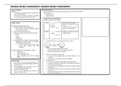
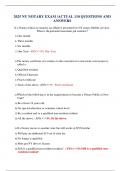
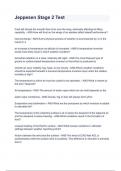
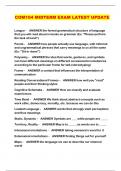
Activity-On-Arrow (AoA) diagrams: Dummy Activity:
Diagrams composed of two symbols:
An activity with zero duration
PROJECT TIMING: Event Event has zero time duration Used when it becomes necessary to draw two
Represents a single state in the activities with same start and finish events
Must have the following information project
Activities required to achieve project goal i.e denotes the start or end of an Incorrect Correct
o The list of every action that should be completed activity or a set of activities
for the project to succeed
Time required to finish each activity Activity Activity has a time and name
Resources required to finish each activity including associated with it
o People
o Tools
o Machines
o Infrastructure
Interdependencies of activities on each other (logic)
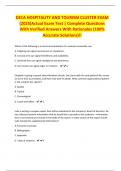
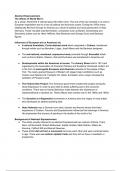
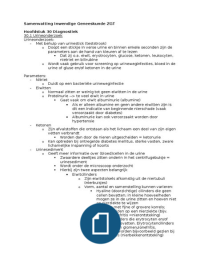
An activity starts from an event and ends with an event e.g.
o Highlighting the temporal order of the activities
in relationship to other activities
i.e. when an activity can only start when
certain other activities have been
completed
o Event 1 represents initial state of a project
Techniques used for time management in a project: o Activity A represents the act needed to reach event 2
Gantt charts o Event 2 is the final state of the project
Network diagrams
Critical path analysis (CPA) Logic of AoA is based on two principles
Project evaluation and review technique o An event does not happen until all activities leading to it are
(PERT) complete
o No activity can start until its start event is complete
Constraints of AoA
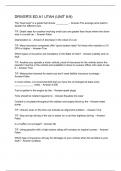
GANNT CHART:
o A network is a collection of interrelated events and activities
A bar chart that shows the activity breakdown of
o A network should start and end with an event (called start and end)
the project on one axis and the timings of the tasks
o Time moves from left to right
on the other axis
Time dependencies and resources for each task o The start event is the only event in the network without activities
can also be displayed on these charts leading into it
Simple to use and understand o The end event is the only event in the network without activities
Can be used for presenting time elements of leading out
projects in a simple manner o Loops are disallowed and no two activities can have both the same
start and same end events
PROJECT CONTROLS: NETWORK DIAGRAMS:
Definition: Used to show interdependency logic of a project in order to perform CPA and PERT
Techniques to ensure that a project is completed on Types of diagrams
time and within budget o Activity-on-Arrow
Nb a project is a temporary endeavour undertaken o Activity-on-Node
to create a unique product, service or result
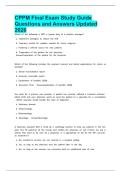
Activity-On-Arrow (AoA) diagrams: Dummy Activity:
Diagrams composed of two symbols:
An activity with zero duration
PROJECT TIMING: Event Event has zero time duration Used when it becomes necessary to draw two
Represents a single state in the activities with same start and finish events
Must have the following information project
Activities required to achieve project goal i.e denotes the start or end of an Incorrect Correct
o The list of every action that should be completed activity or a set of activities
for the project to succeed
Time required to finish each activity Activity Activity has a time and name
Resources required to finish each activity including associated with it
o People
o Tools
o Machines
o Infrastructure
Interdependencies of activities on each other (logic)
An activity starts from an event and ends with an event e.g.
o Highlighting the temporal order of the activities
in relationship to other activities
i.e. when an activity can only start when
certain other activities have been
completed
o Event 1 represents initial state of a project
Techniques used for time management in a project: o Activity A represents the act needed to reach event 2
Gantt charts o Event 2 is the final state of the project
Network diagrams
Critical path analysis (CPA) Logic of AoA is based on two principles
Project evaluation and review technique o An event does not happen until all activities leading to it are
(PERT) complete
o No activity can start until its start event is complete
Constraints of AoA
GANNT CHART:
o A network is a collection of interrelated events and activities
A bar chart that shows the activity breakdown of
o A network should start and end with an event (called start and end)
the project on one axis and the timings of the tasks
o Time moves from left to right
on the other axis
Time dependencies and resources for each task o The start event is the only event in the network without activities
can also be displayed on these charts leading into it
Simple to use and understand o The end event is the only event in the network without activities
Can be used for presenting time elements of leading out
projects in a simple manner o Loops are disallowed and no two activities can have both the same
start and same end events