1
EXERCISE 5 SUGGESTED SOLUTION
1. SAS Program
data fit_ar2;
n=500;
seed=0;
theta0=120;
phi1=0.2;
phi2=0.6;
mu=theta0/(1-phi1-phi2);
var_at=100;
zt_2=mu;
zt_1=mu;
do t = -49 to n;
at=sqrt(var_at)*rannor(seed);
zt=theta0+phi1*zt_1+phi2*zt_2+at;
if t > 0 then output;
zt_2=zt_1;
zt_1=zt;
end;
run;
2. SAS Program
goptions reset=all;
title1 'Simulated AR(2) series';
proc arima data=fit_ar2 plots(only)=series(acf pacf);
identify var=zt nlag=12;
estimate p=2 method=ml;
run;
SAS Output
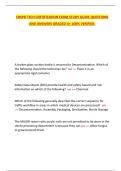
Simulated AR(2) series
The ARIMA Procedure
Name of Variable = zt
Mean of Working Series 599.09
Standard Deviation 14.76223
Number of Observations 500
Autocorrelation Check for White Noise
To Lag Chi-Square DF Pr > ChiSq Autocorrelations
6 683.45 6 <.0001 0.499 0.689 0.388 0.507 0.290 0.371
12 806.30 12 <.0001 0.227 0.281 0.171 0.203 0.152 0.128
WST321
EXERCISE 5 SUGGESTED SOLUTION
1. SAS Program
data fit_ar2;
n=500;
seed=0;
theta0=120;
phi1=0.2;
phi2=0.6;
mu=theta0/(1-phi1-phi2);
var_at=100;
zt_2=mu;
zt_1=mu;
do t = -49 to n;
at=sqrt(var_at)*rannor(seed);
zt=theta0+phi1*zt_1+phi2*zt_2+at;
if t > 0 then output;
zt_2=zt_1;
zt_1=zt;
end;
run;
2. SAS Program
goptions reset=all;
title1 'Simulated AR(2) series';
proc arima data=fit_ar2 plots(only)=series(acf pacf);
identify var=zt nlag=12;
estimate p=2 method=ml;
run;
SAS Output
Simulated AR(2) series
The ARIMA Procedure
Name of Variable = zt
Mean of Working Series 599.09
Standard Deviation 14.76223
Number of Observations 500
Autocorrelation Check for White Noise
To Lag Chi-Square DF Pr > ChiSq Autocorrelations
6 683.45 6 <.0001 0.499 0.689 0.388 0.507 0.290 0.371
12 806.30 12 <.0001 0.227 0.281 0.171 0.203 0.152 0.128
WST321