1
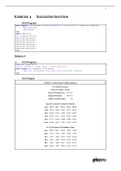
EXERCISE 4 SUGGESTED SOLUTION
SAS Program
proc import out=sasuser.ts1to6 datafile='c:\exercise4.csv' dbms=csv replace;
getnames=yes;
datarow=2;
run;
data identify;
set sasuser.ts1to6;
dser1=dif(series1);
dser2=dif(series2);
dser3=dif(series3);
dser4=dif(series4);
dser5=dif(series5);
dser6=dif(series6);
run;
SERIES 1
(a) SAS Program
goptions reset=all;
title1 'SERIES 1: SCAN, ESACF & MINIC Methods';
proc arima data=identify plot=none;
identify var=series1 scan esacf minic p=(0:4) q=(0:4);
run;
SAS Output
SERIES 1: SCAN, ESACF & MINIC Methods
The ARIMA Procedure
Name of Variable = Series1
Mean of Working Series 620.7027
Standard Deviation 48.40734
Number of Observations 700
Squared Canonical Correlation Estimates
Lags MA 0 MA 1 MA 2 MA 3 MA 4
AR 0 0.9970 0.9969 0.9943 0.9917 0.9889
AR 1 0.2260 0.1692 0.0001 0.0014 0.0007
AR 2 0.0576 0.1613 0.0014 0.0013 0.0005
AR 3 0.1175 0.0446 0.0008 0.0006 0.0011
AR 4 0.0048 0.0419 <.0001 0.0003 0.0010
SCAN Chi-Square[1] Probability Values
Lags MA 0 MA 1 MA 2 MA 3 MA 4
AR 0 <.0001 <.0001 <.0001 <.0001 <.0001
AR 1 <.0001 <.0001 0.8244 0.4687 0.6084
AR 2 <.0001 <.0001 0.4750 0.4633 0.6396
AR 3 <.0001 <.0001 0.5911 0.5749 0.6139
AR 4 0.0679 <.0001 0.9522 0.7616 0.6315
WST321
, 2
Extended Sample Autocorrelation Function
Lags MA 0 MA 1 MA 2 MA 3 MA 4
AR 0 0.9930 0.9875 0.9808 0.9739 0.9673
AR 1 -0.4909 0.4037 -0.0224 0.0263 -0.0372
AR 2 0.3979 0.4011 0.1412 -0.0024 -0.0367
AR 3 -0.4941 0.3496 0.3571 0.1715 -0.0289
AR 4 -0.2004 0.3762 0.0390 -0.1416 0.1675
ESACF Probability Values
Lags MA 0 MA 1 MA 2 MA 3 MA 4
AR 0 <.0001 <.0001 <.0001 <.0001 <.0001
AR 1 <.0001 <.0001 0.6591 0.6046 0.4647
AR 2 <.0001 <.0001 0.0010 0.9607 0.4641
AR 3 <.0001 <.0001 <.0001 0.0030 0.5257
AR 4 <.0001 <.0001 0.4347 0.0032 0.0006
Minimum Information Criterion
Lags MA 0 MA 1 MA 2 MA 3 MA 4
AR 0 7.737892 7.721587 7.671024 7.636208 7.619054
AR 1 1.93244 1.694605 1.593823 1.501374 1.506337
AR 2 1.686847 1.695624 1.507065 1.51072 1.481473
AR 3 1.635156 1.523962 1.511512 1.519546 1.472633
AR 4 1.517152 1.521738 1.491085 1.471467 1.480764
Error series model: AR(4)
Minimum Table Value: BIC(4,3) = 1.471467
ARMA(p+d,q) Tentative Order Selection
Tests
SCAN ESACF
p+d q BIC p+d q BIC
1 2 1.593823 1 2 1.593823
(5% Significance Level)
The SCAN and ESACF methods both suggest that ~ p = p + d = 1 and q = 2 , whereas
~
the MINIC method suggests that p = p + d = 4 and that q = 3 (which is unlikely).
WST321
, 3
(b) SAS Program
goptions reset=all i=join;
axis1 label=(angle=90 'First Difference of Series 1');
symbol1 color=blue;
title1 'SERIES 1: ADF Test';
proc gplot data=identify;
plot dser1*t / vaxis=axis1;
run;
goptions reset=all i=join;
axis1 label=(angle=90 'Series 1');
symbol1 color=blue;
title1 'SERIES 1: ADF Test';
proc gplot data=identify;
plot series1*t / vaxis=axis1;
run;
proc arima data=identify plot=none;
identify var=series1(1) stationarity=(adf=(0,1,2));
identify var=series1 stationarity=(adf=(0,1,2));
run;
SAS Output
WST321
, 4
SERIES 1: ADF Test
The ARIMA Procedure
Name of Variable = Series1
Period(s) of Differencing 1
Mean of Working Series -0.27252
Standard Deviation 2.610582
Number of Observations 699
Observation(s) eliminated by differencing 1
Augmented Dickey-Fuller Unit Root Tests
Type Lags Rho Pr < Rho Tau Pr < Tau F Pr > F
Zero Mean 0 -1029.70 0.0001 -44.33 <.0001
1 -630.103 0.0001 -17.72 <.0001
2 -250.290 0.0001 -10.28 <.0001
Single Mean 0 -1040.93 0.0001 -45.22 <.0001 1022.31 0.0010
1 -669.759 0.0001 -18.26 <.0001 166.76 0.0010
2 -272.431 0.0001 -10.65 <.0001 56.66 0.0010
Trend 0 -1040.94 0.0001 -45.19 <.0001 1020.90 0.0010
1 -669.797 0.0001 -18.25 <.0001 166.52 0.0010
2 -272.434 0.0001 -10.64 <.0001 56.58 0.0010
Name of Variable = Series1
Mean of Working Series 620.7027
Standard Deviation 48.40734
Number of Observations 700
Augmented Dickey-Fuller Unit Root Tests
Type Lags Rho Pr < Rho Tau Pr < Tau F Pr > F
Zero Mean 0 -0.3108 0.6122 -2.80 0.0051
1 -0.3031 0.6139 -4.66 <.0001
2 -0.3061 0.6132 -3.71 0.0002
Single Mean 0 -0.9667 0.8892 -0.68 0.8505 4.03 0.0847
1 -0.1766 0.9480 -0.21 0.9345 10.83 0.0010
2 -0.4089 0.9335 -0.39 0.9082 6.89 0.0010
Trend 0 -15.1695 0.1770 -2.75 0.2161 3.79 0.4145
1 -4.9038 0.8271 -1.50 0.8275 1.15 0.9465
2 -7.9882 0.5838 -1.95 0.6292 1.90 0.7962
We first determine whether Series 1 has 2 unit roots by testing H 0 : d = 1 against
H 1 : d = 0 with respect to the first difference of Series 1. The time plot indicates that
the first difference of Series 1 fluctuates around a zero mean, so Case 1 of the ADF test
is applicable.
WST321