Bioinformatics: use informatics to analyse biological data
- start with informatic skills
Computational biology: answer biological questions using computational resources
1958-1960: Comprotein: determine protein primary structure from peptide (50-60 amino acids)
sequencing data → start bioinformatics
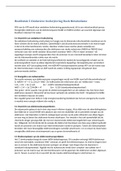
Central dogma (bio information flow)
- DNA → RNA → protein → phenotype
→ main bioinformatics ingredients
- data: where to get data? How data was produced? Submission of data to repositories
- tools: development of tools, which tools exist already? How to install them and run them?
- results: what my results mean? Reporting results to wet-lab people
Paradigm shift: hypothesis-drive research → data exploration approach (don’t come up with
hypotheses first, look at what the data tells you)
Data should be good (garbage in, garbage out) and reproducible (because of sharing the preliminary
information)
BASIC STATISTICS 1
Measurements
- you always have to define your experiments properly
- what is the main source of variation? → rethink your experiment
- after standardization, do we always get exact the same value?
- if you do experiments the results can show variation
- where does this variation come from
- you always should define your experiments properly
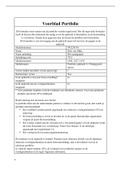
What is un-likely → 5% → p = 0.05
- p-value = 0.05 is often used as cutoff
- same statistics, same p-value, different ‘impact of
risk’: impact of the failure → ethical discussion
- issue with statistics: you can calculate p-values,
but it never tells you if it’s good or bad →
- what is the risk for a patient?
- what are the risks for not treating a patient?
- until which age should you treat a patient?
A p-value cutoff of 0.05 is a good starting point but
always evaluate this assumption
Generating data
1. A statistician wants:
- a good designed study that answers the question → the basis of a good study
- trustworthy data → how trustworthy is your experiment?
- many replicates (but minimize the amount, due to costs or ethical reasons) → how many do you
really need?
2. A statistician knows how to:
- analyze data appropriately
- calculate p-values
,3. A statistician mostly does not know:
- detailed theoretical background of the data
- impact of risk: how to choose the threshold
- potential pitfalls
Impact of risk high → more replicates (decrease the number of error)
t-statistic
- William Sealy Gosset (1876), who developed the “t-statistic” and published it under the pseudonym
of “Student”
- compares two data sets and tells you if they are different from each other → e.g. compare two
groups, one treated with a drug the other with a placebo
- Pearson 1857, Fisher 1890, Neyman 1894 (Random stats), Bayes 1702 (Probability stats)
- comparing the means of two groups
Types of t-tests
1. Independent samples: compares the means for two independent groups
2. Paired samples: compares means from the same group (e.g. at different times)
3. One Sample: test the mean of a single group against a known mean (a standard or reference)
Paired data: a sample (or maybe a gene expression value) measured before and after a
treatment
- 8 similar mice were used for the measurements → 8 replicates
- do you see a difference before and after treatment → is there a significant difference
before and after treatment?
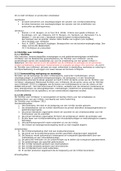
Paired samples t-test by hand
- we assume H0μA = μB or write it as H0 (μA – μB) = 0
- subtract 1 from the sample size to get the Degrees of Freedom (DF) → we have 8
samples, so DF = 8-1 = 7
- how to decide which alpha level to use?
- let’s decide that we want p-value < 0.05 and find the t-value in the T-distribution table
- the calculated t-value (ignore minus sign) is greater than the table value (2.77)
- 2.77 > 2.365 meaning: reject that they are equal
Independent samples t-test
- compare the means of two sets of data
- assumptions:
1. Independence: you need two independent, categorical groups (e.g. males and females)
2. Normality: the dependent variable should be approximately normally distributed (on a continuous
, scale)
3. Homogeneity of variance: variances should be equal
- you can have different numbers of samples
- degrees of freedom = nA-1 + nB-1
- calculated t-value < t-value in t-distribution table → we
cannot conclude that there is a difference
Linear regression
- to compare samples
- regression analysis is used to
find equations that fit data
- linear regression: y = a + bx
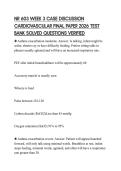
Which log base is the best?
- question: we follow cell proliferation in tissue, and plot number of cells against replication cycles →
during each cycle the number of cells is doubled → which log base should you take when plotting a
curve? ln, log2, log10?
- use log(2) if it as doubling
- log(10) was always used, because there was only log(10) paper
→ which log base will give a straight line?
BASIC STATISTICS 2
Outlier: assume that the measurement was wrong
- can we define outliers?
Outlier detection
- reduce data complexity, from multiple values to one
- look at the mean: mean does not represent the data series due to one value
- for the t-test we want a reliable mean
- median: sort and take the middle (seems better to represent the data
series)
- we want an uniform solution to remove outliers
- quartiles are often used to divide data in 4 portions
- Q1 = the middle number between the smallest number and the median of
the data set (round(N/4))
- Q2 = the median
- Q3 = the middle number between the largest number and the median of
the data set (N (number of data points) – Q1 + 1)
- interquartile range (IQR) = Q3-Q1
- uniform solution for removing outliers:
remove all values < Q1 – 1.5 * IQR
remove all values > Q3 + 1.5 * IQR
- do you always want to remove outliers? → we used an assumption here!
→ be careful with assumptions
Permutation testing: used when we have insufficient information about the distribution of the data
- the t-test assumes that the data is normally distributed → but is your data always normally
distributed?
- is the data linear or logarithmic
- how to determine the data properties
- start with informatic skills
Computational biology: answer biological questions using computational resources
1958-1960: Comprotein: determine protein primary structure from peptide (50-60 amino acids)
sequencing data → start bioinformatics
Central dogma (bio information flow)
- DNA → RNA → protein → phenotype
→ main bioinformatics ingredients
- data: where to get data? How data was produced? Submission of data to repositories
- tools: development of tools, which tools exist already? How to install them and run them?
- results: what my results mean? Reporting results to wet-lab people
Paradigm shift: hypothesis-drive research → data exploration approach (don’t come up with
hypotheses first, look at what the data tells you)
Data should be good (garbage in, garbage out) and reproducible (because of sharing the preliminary
information)
BASIC STATISTICS 1
Measurements
- you always have to define your experiments properly
- what is the main source of variation? → rethink your experiment
- after standardization, do we always get exact the same value?
- if you do experiments the results can show variation
- where does this variation come from
- you always should define your experiments properly
What is un-likely → 5% → p = 0.05
- p-value = 0.05 is often used as cutoff
- same statistics, same p-value, different ‘impact of
risk’: impact of the failure → ethical discussion
- issue with statistics: you can calculate p-values,
but it never tells you if it’s good or bad →
- what is the risk for a patient?
- what are the risks for not treating a patient?
- until which age should you treat a patient?
A p-value cutoff of 0.05 is a good starting point but
always evaluate this assumption
Generating data
1. A statistician wants:
- a good designed study that answers the question → the basis of a good study
- trustworthy data → how trustworthy is your experiment?
- many replicates (but minimize the amount, due to costs or ethical reasons) → how many do you
really need?
2. A statistician knows how to:
- analyze data appropriately
- calculate p-values
,3. A statistician mostly does not know:
- detailed theoretical background of the data
- impact of risk: how to choose the threshold
- potential pitfalls
Impact of risk high → more replicates (decrease the number of error)
t-statistic
- William Sealy Gosset (1876), who developed the “t-statistic” and published it under the pseudonym
of “Student”
- compares two data sets and tells you if they are different from each other → e.g. compare two
groups, one treated with a drug the other with a placebo
- Pearson 1857, Fisher 1890, Neyman 1894 (Random stats), Bayes 1702 (Probability stats)
- comparing the means of two groups
Types of t-tests
1. Independent samples: compares the means for two independent groups
2. Paired samples: compares means from the same group (e.g. at different times)
3. One Sample: test the mean of a single group against a known mean (a standard or reference)
Paired data: a sample (or maybe a gene expression value) measured before and after a
treatment
- 8 similar mice were used for the measurements → 8 replicates
- do you see a difference before and after treatment → is there a significant difference
before and after treatment?
Paired samples t-test by hand
- we assume H0μA = μB or write it as H0 (μA – μB) = 0
- subtract 1 from the sample size to get the Degrees of Freedom (DF) → we have 8
samples, so DF = 8-1 = 7
- how to decide which alpha level to use?
- let’s decide that we want p-value < 0.05 and find the t-value in the T-distribution table
- the calculated t-value (ignore minus sign) is greater than the table value (2.77)
- 2.77 > 2.365 meaning: reject that they are equal
Independent samples t-test
- compare the means of two sets of data
- assumptions:
1. Independence: you need two independent, categorical groups (e.g. males and females)
2. Normality: the dependent variable should be approximately normally distributed (on a continuous
, scale)
3. Homogeneity of variance: variances should be equal
- you can have different numbers of samples
- degrees of freedom = nA-1 + nB-1
- calculated t-value < t-value in t-distribution table → we
cannot conclude that there is a difference
Linear regression
- to compare samples
- regression analysis is used to
find equations that fit data
- linear regression: y = a + bx
Which log base is the best?
- question: we follow cell proliferation in tissue, and plot number of cells against replication cycles →
during each cycle the number of cells is doubled → which log base should you take when plotting a
curve? ln, log2, log10?
- use log(2) if it as doubling
- log(10) was always used, because there was only log(10) paper
→ which log base will give a straight line?
BASIC STATISTICS 2
Outlier: assume that the measurement was wrong
- can we define outliers?
Outlier detection
- reduce data complexity, from multiple values to one
- look at the mean: mean does not represent the data series due to one value
- for the t-test we want a reliable mean
- median: sort and take the middle (seems better to represent the data
series)
- we want an uniform solution to remove outliers
- quartiles are often used to divide data in 4 portions
- Q1 = the middle number between the smallest number and the median of
the data set (round(N/4))
- Q2 = the median
- Q3 = the middle number between the largest number and the median of
the data set (N (number of data points) – Q1 + 1)
- interquartile range (IQR) = Q3-Q1
- uniform solution for removing outliers:
remove all values < Q1 – 1.5 * IQR
remove all values > Q3 + 1.5 * IQR
- do you always want to remove outliers? → we used an assumption here!
→ be careful with assumptions
Permutation testing: used when we have insufficient information about the distribution of the data
- the t-test assumes that the data is normally distributed → but is your data always normally
distributed?
- is the data linear or logarithmic
- how to determine the data properties