SPSS – Andy Field summary Chapter 1
Quantitative methods: numbers involved and Qualitative methods:
language involved
The research process: First you have an observation, based on data or on an
own (anecdotal) observation. From this can you generate explanations, or theory.
With this theory you can make predictions, or hypothesis. Now you have to
collect data, and analyze this data. This data can support the theory or give
cause to modify the theory.
In order to collect data, you first have to define one or more variables and then
you have to measure them. An independent variable or predictor variable is
the cause, and a dependent variable or outcome variable is the effect, which
depends on the cause.
Falsification is the act of disproving a hypothesis or theory.
The level of measurement shows the relationship between what is being
measured and the numbers that represent what is being measured (categorical
or continuous).
- A categorical variable is made up of categories, and can be unorderd or
ordered.
binary variables: only 2 categories, for example male and female.
Nominal variable: more than two possibilities, for example omnivore,
vegetaria, vegan.
Ordinal variable: the same as nominal variable, but the categories hace
a logical order.
- A continuous variable gives a score for each entity and can take any value on
the measurement scale that we are using. It can be continious or discrete.
Interval variable: To say data are intervals, we must be sure that equal
intervals on the scale represents equal differences in the property being
measured.
Ratio variables go a step further: the ratios of scores on the scale must
also make sense. Herefore the scale must have a true zero point.
A truly continious variable (f.e. age) can be measured on any level, whereas a
discrete variable can only take certain values on the scale.
Measurement error: the difference between the actual value we’re trying to
measure, and the number we use to represent that value.
To minimize measurement error you can use validity: are we really measuring,
what we intend to measure. There are five types of validity:
1. Criterion validity: does the research really measure what it is supposed to?
2. Concurrent validity: when data are recorderd simultaneously using the new
instrument and existing criteria
3. Predictive validity: when data from the new instrument are used to predict
observations at a later point in time.
4. Content validity: does the content of the test correspond to the content it
was designed to cover?
5. ecological validity: are the findings applicable to people’s everyday natural
setting?
Reliability is concerned with the question of whether the results of a study are
repeatable.
, Test-retest-reliability: test the same group of people twice; a reliable
instrument will produce same scores at the same time.
There are two ways to test hypothesis: observing what naturally happens
(correlational or cross-sectional research) or manipulating some aspects of
the environment (experimental research).
The tertium quid: a third person/thing of indeterminate character. Also called
confounding variables.
Experimental methods: provide a comparison of situations in which the
proposed cause is present and absent.
When we collect data, we can choose between two methods:
1. Manipulate the independent variable using different entities, which take part in
each experimental condition (a between-groups, between-subjects or
independent design)
2. Manipulate the independent variable using the same entities. So, one group of
people get all the different forms of manipulations (a within-subject or
repeated-measures design).
Unsystematic variation: small differences in performance created by unknow
factors. This resulsts fro random factors that exist between the experimental
conditions.
Systematic variation: differences in performance created by a specific
experimental manipulation.
It is important to minimize the unsystematic variation; therefore scientists use
the randomization. Randominization is important, because it removes most other
sources of systematic variation, which allows us to be sure that any systematic
variation is due to the manipulation of the independent variable. There are two
sources of systematic variation:
practice effects: participants may perform differently in the second
condition, because of familarity with the experimental situation and/or the
measures being used.
Boredom effects: participants may perform differently in the second
condition, because they are tired or bored from having completed the first
condition.
We cannot remove this effects completely, but we can ensure that it produces no
systematic variation, through counterbalancing the order in which a person
participates in a condition.
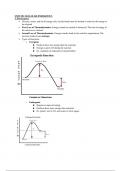
If you have collected the data, you have to plot a graph.
A frequency distribution/histogram is a graph plotting values of observations
on the horizontal axis, with a bar showing how many times each value occurred
in the data set. Frequency distributions has many different shapes. A normal
distribution has a bell-shaped curve; which means that the majority of the
scores lie around the centre. Two ways a graph can differ from the normal:
1. lack of symmetry, the most scores are clusterd at one end of the scale =
skew
Positively skewed = the frequent scores are clustered at the lower end
Negatively skewed = the frequent scores are clustered at the higher end
Quantitative methods: numbers involved and Qualitative methods:
language involved
The research process: First you have an observation, based on data or on an
own (anecdotal) observation. From this can you generate explanations, or theory.
With this theory you can make predictions, or hypothesis. Now you have to
collect data, and analyze this data. This data can support the theory or give
cause to modify the theory.
In order to collect data, you first have to define one or more variables and then
you have to measure them. An independent variable or predictor variable is
the cause, and a dependent variable or outcome variable is the effect, which
depends on the cause.
Falsification is the act of disproving a hypothesis or theory.
The level of measurement shows the relationship between what is being
measured and the numbers that represent what is being measured (categorical
or continuous).
- A categorical variable is made up of categories, and can be unorderd or
ordered.
binary variables: only 2 categories, for example male and female.
Nominal variable: more than two possibilities, for example omnivore,
vegetaria, vegan.
Ordinal variable: the same as nominal variable, but the categories hace
a logical order.
- A continuous variable gives a score for each entity and can take any value on
the measurement scale that we are using. It can be continious or discrete.
Interval variable: To say data are intervals, we must be sure that equal
intervals on the scale represents equal differences in the property being
measured.
Ratio variables go a step further: the ratios of scores on the scale must
also make sense. Herefore the scale must have a true zero point.
A truly continious variable (f.e. age) can be measured on any level, whereas a
discrete variable can only take certain values on the scale.
Measurement error: the difference between the actual value we’re trying to
measure, and the number we use to represent that value.
To minimize measurement error you can use validity: are we really measuring,
what we intend to measure. There are five types of validity:
1. Criterion validity: does the research really measure what it is supposed to?
2. Concurrent validity: when data are recorderd simultaneously using the new
instrument and existing criteria
3. Predictive validity: when data from the new instrument are used to predict
observations at a later point in time.
4. Content validity: does the content of the test correspond to the content it
was designed to cover?
5. ecological validity: are the findings applicable to people’s everyday natural
setting?
Reliability is concerned with the question of whether the results of a study are
repeatable.
, Test-retest-reliability: test the same group of people twice; a reliable
instrument will produce same scores at the same time.
There are two ways to test hypothesis: observing what naturally happens
(correlational or cross-sectional research) or manipulating some aspects of
the environment (experimental research).
The tertium quid: a third person/thing of indeterminate character. Also called
confounding variables.
Experimental methods: provide a comparison of situations in which the
proposed cause is present and absent.
When we collect data, we can choose between two methods:
1. Manipulate the independent variable using different entities, which take part in
each experimental condition (a between-groups, between-subjects or
independent design)
2. Manipulate the independent variable using the same entities. So, one group of
people get all the different forms of manipulations (a within-subject or
repeated-measures design).
Unsystematic variation: small differences in performance created by unknow
factors. This resulsts fro random factors that exist between the experimental
conditions.
Systematic variation: differences in performance created by a specific
experimental manipulation.
It is important to minimize the unsystematic variation; therefore scientists use
the randomization. Randominization is important, because it removes most other
sources of systematic variation, which allows us to be sure that any systematic
variation is due to the manipulation of the independent variable. There are two
sources of systematic variation:
practice effects: participants may perform differently in the second
condition, because of familarity with the experimental situation and/or the
measures being used.
Boredom effects: participants may perform differently in the second
condition, because they are tired or bored from having completed the first
condition.
We cannot remove this effects completely, but we can ensure that it produces no
systematic variation, through counterbalancing the order in which a person
participates in a condition.
If you have collected the data, you have to plot a graph.
A frequency distribution/histogram is a graph plotting values of observations
on the horizontal axis, with a bar showing how many times each value occurred
in the data set. Frequency distributions has many different shapes. A normal
distribution has a bell-shaped curve; which means that the majority of the
scores lie around the centre. Two ways a graph can differ from the normal:
1. lack of symmetry, the most scores are clusterd at one end of the scale =
skew
Positively skewed = the frequent scores are clustered at the lower end
Negatively skewed = the frequent scores are clustered at the higher end