Unit 4 – Analysis and Interpretation
Ratios are useful tools
We calculate ratios by using the accounts to help with analysing relationships and changes
within a business. These ratios help to analyse year on year growth or decline, such as sales
revenue or profit. We can also use the calculations from the ratios in order to compare
similar businesses with each other and asses how they’re doing.
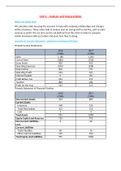
Example of: Income Statement + Statement of Financial Position
Threads Income Statements
2016 2017
£’000s £’000s
Sales 1,180 1,200
Cost of Sales (680) (750)
Gross Profit 500 450
Operating Expenses (200) (208)
Depreciation (66) (75)
Operating Profit 234 167
Interest Payable 0 (8)
Profit Before Tax 234 159
Taxation (80) (48)
Profit for the Year 154 111
Threads Statement of Financial Position
2016 2017
£’000s £’000s
Non-Current Assets 702 687
Current Assets
Inventory 148 236
Trade Receivables 102 156
Cash 3 4
Total Assets 955 1083
Equity Capital and Reserves 756 795
Non-Current Liabilities – 0 50
Loan
Current Liabilities
Trade Payables 60 76
Other Current Liabilities 139 162
Total Equity and Liabilities 955 1083
Ratios are useful tools
We calculate ratios by using the accounts to help with analysing relationships and changes
within a business. These ratios help to analyse year on year growth or decline, such as sales
revenue or profit. We can also use the calculations from the ratios in order to compare
similar businesses with each other and asses how they’re doing.
Example of: Income Statement + Statement of Financial Position
Threads Income Statements
2016 2017
£’000s £’000s
Sales 1,180 1,200
Cost of Sales (680) (750)
Gross Profit 500 450
Operating Expenses (200) (208)
Depreciation (66) (75)
Operating Profit 234 167
Interest Payable 0 (8)
Profit Before Tax 234 159
Taxation (80) (48)
Profit for the Year 154 111
Threads Statement of Financial Position
2016 2017
£’000s £’000s
Non-Current Assets 702 687
Current Assets
Inventory 148 236
Trade Receivables 102 156
Cash 3 4
Total Assets 955 1083
Equity Capital and Reserves 756 795
Non-Current Liabilities – 0 50
Loan
Current Liabilities
Trade Payables 60 76
Other Current Liabilities 139 162
Total Equity and Liabilities 955 1083