lOMoARcPSD|11911780
Corporate Finance
Chapter 1
Finance is about forecasting future cashflows.
Financial Goals:
- Profitability -> The main goal for finance (Highest possible profit)
- Liquidity -> You need liquidity to continue.
- Security;
- Independence.
Primary Markets: If the company for the very first time issues the
shares = Initial public offering.
Secondary Markets: Normally when you buy shares/securities, you buy
it from another investor. Investors trade securities with each other.
Money that is raised goes to seller of securities.
Chapter 3: Financial Statement Analysis
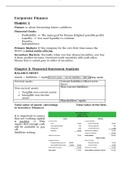
BALANCE SHEET
Assets = liabilities + equityCurrent assets – current liabilities = Net working capital
Current assets Current liabilities (Short-term
base)
Non-current liabilities
Non-current assets:
1. Tangible non-current assets
2. Intangible non-current
assets
Shareholders’ equity
Total value of assets (Investing) Total value of the firm
to investors (Finance)
It is important to ensure
that net working capital
is positive -> This
means that enough cash
will be available to pay
off
liabilities arising.
, lOMoARcPSD|11911780
Book value based on Accounting Figures drawn from accounting
standards. -> Accounting
Market value based on prices or market valuations. -> Finance
INCOME SHEET
EBT = Earnings
before tax
EBIT = Earnings
before interest and
tax
EBITD(A) =
Earnings before
interest, tax,
depreciation/appreci
ation.
Average tax rate = how much tax do you pay in average. (56/511=11%)
Marginal tax rate = what would be the additional tax if you earn one
more unit of currency.
NL: 1st 25,000 euro -> 20%, Next 35,000 euro -> 23.5%, Any extra ->
25.5% (=Increasing marginal tax rate)
CASH FLOW STATEMENT
Total cashflows comes from:
- Operating activities
- Investing activities
- Financing activities
Cash flow is not Working Capital.
WC is a snapshot.
CF is the earning ability over a
time period.
,lOMoARcPSD|11911780
, lOMoARcPSD|11911780
Cash flow is not profit.
Depreciation decreases the profit but not the cash flow.
RATIO ANALYSIS
It is important to be able to analyze a firm’s financial statements and
compare them to other firms.
*On the exam you get a paper with all the formulas.
- Profitability ratios;
Net income
Profit margin= →operating efficiency
sales
Net Income
Return on Asset= → Asset use efficiency
Total Assets
Net Income
Return on equity= →Equity
efficiency Total Equity
- Financial leverage ratio
debt Debt Debt
Debt−equity ratio= Total debt ratio= =
equity Equity + Total assets
Debt
Total assets
Equity multiplier= → at least 1, ussually higher
equity
- Market value ratios;
Net Income
Earning Per Share ( EPS )= → how much profit per share
Shares outstanding
Price per Share
PE Ratio= →How expensive is ashare ∈relation withthe profit the company
made .
EPS
THE DU PONT IDENTITY
Return On Equity =
The Du Pont
Identity:
Corporate Finance
Chapter 1
Finance is about forecasting future cashflows.
Financial Goals:
- Profitability -> The main goal for finance (Highest possible profit)
- Liquidity -> You need liquidity to continue.
- Security;
- Independence.
Primary Markets: If the company for the very first time issues the
shares = Initial public offering.
Secondary Markets: Normally when you buy shares/securities, you buy
it from another investor. Investors trade securities with each other.
Money that is raised goes to seller of securities.
Chapter 3: Financial Statement Analysis
BALANCE SHEET
Assets = liabilities + equityCurrent assets – current liabilities = Net working capital
Current assets Current liabilities (Short-term
base)
Non-current liabilities
Non-current assets:
1. Tangible non-current assets
2. Intangible non-current
assets
Shareholders’ equity
Total value of assets (Investing) Total value of the firm
to investors (Finance)
It is important to ensure
that net working capital
is positive -> This
means that enough cash
will be available to pay
off
liabilities arising.
, lOMoARcPSD|11911780
Book value based on Accounting Figures drawn from accounting
standards. -> Accounting
Market value based on prices or market valuations. -> Finance
INCOME SHEET
EBT = Earnings
before tax
EBIT = Earnings
before interest and
tax
EBITD(A) =
Earnings before
interest, tax,
depreciation/appreci
ation.
Average tax rate = how much tax do you pay in average. (56/511=11%)
Marginal tax rate = what would be the additional tax if you earn one
more unit of currency.
NL: 1st 25,000 euro -> 20%, Next 35,000 euro -> 23.5%, Any extra ->
25.5% (=Increasing marginal tax rate)
CASH FLOW STATEMENT
Total cashflows comes from:
- Operating activities
- Investing activities
- Financing activities
Cash flow is not Working Capital.
WC is a snapshot.
CF is the earning ability over a
time period.
,lOMoARcPSD|11911780
, lOMoARcPSD|11911780
Cash flow is not profit.
Depreciation decreases the profit but not the cash flow.
RATIO ANALYSIS
It is important to be able to analyze a firm’s financial statements and
compare them to other firms.
*On the exam you get a paper with all the formulas.
- Profitability ratios;
Net income
Profit margin= →operating efficiency
sales
Net Income
Return on Asset= → Asset use efficiency
Total Assets
Net Income
Return on equity= →Equity
efficiency Total Equity
- Financial leverage ratio
debt Debt Debt
Debt−equity ratio= Total debt ratio= =
equity Equity + Total assets
Debt
Total assets
Equity multiplier= → at least 1, ussually higher
equity
- Market value ratios;
Net Income
Earning Per Share ( EPS )= → how much profit per share
Shares outstanding
Price per Share
PE Ratio= →How expensive is ashare ∈relation withthe profit the company
made .
EPS
THE DU PONT IDENTITY
Return On Equity =
The Du Pont
Identity: