3. Results
3.1 Introduction
In this chapter, the result of each sub question will be presented and analysed. Hereby each sub
question will be presented with the supported data collection method. Additionally the results of the
data collection method will be shown in the form of tables, scatterplots and other visual
representations. After analysing the result, a conclusion will be formed of the findings.
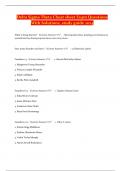
3.2.1 Survey results
Line chart has been removed due to data protection
Line Chart: Number of respondents
The line chart above shows the number of respondents to the published survey, which focused on the
topic of inclusivity within the organization.
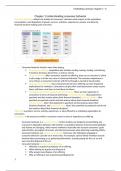
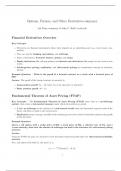
,Figure 1 Bar Chart: Number of respondents
Figure 1, the bar chart shows that number of respondents of each country. The survey has reached 28
employees from the office in The Netherlands and 7 employees from the office in Belgium.
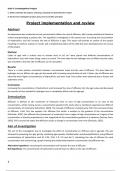
, Figure 2 Table: Survey result Q2 & 3 Illustrating types of ethnicity and Gender Identity
Figure 2 presents a table with the survey results, related to survey question two and three.In
question 2 the respondents were asked to select their ethnic origin. Following question 3, the
respondents were asked to describe their gender identity, by selecting the one that they could identify
the most with. As show in figure 2 the ethnic origin ranges from Belgian to Welsh. Additionally the
number of male respondents were 14 whilst the number of female respondents were 20 in the
majority. Moreover, from this group, one respondent has indicated to have a gender identity as non-
binary. Furthermore, two respondents have indicated to be a female transgender and one respondent
has indicated to be a male transgender.
Figure 3 Bar Chart: Survey results Q4
Figure 3 illustrates a bar chart whereby the result of survey have been presented, concerning question
4. In this part of the survey,, the respondents were asked to indicate whether they identify as a person
with a disability. From the Bar chart it can be seen that the majority has indicated to not having a
disability. Additionally the chart also shows that a number of respondents indicated that they might
identify as a person with a disability. Moreover, 1 respondent has indicated to having a mental illness.
3.1 Introduction
In this chapter, the result of each sub question will be presented and analysed. Hereby each sub
question will be presented with the supported data collection method. Additionally the results of the
data collection method will be shown in the form of tables, scatterplots and other visual
representations. After analysing the result, a conclusion will be formed of the findings.
3.2.1 Survey results
Line chart has been removed due to data protection
Line Chart: Number of respondents
The line chart above shows the number of respondents to the published survey, which focused on the
topic of inclusivity within the organization.
,Figure 1 Bar Chart: Number of respondents
Figure 1, the bar chart shows that number of respondents of each country. The survey has reached 28
employees from the office in The Netherlands and 7 employees from the office in Belgium.
, Figure 2 Table: Survey result Q2 & 3 Illustrating types of ethnicity and Gender Identity
Figure 2 presents a table with the survey results, related to survey question two and three.In
question 2 the respondents were asked to select their ethnic origin. Following question 3, the
respondents were asked to describe their gender identity, by selecting the one that they could identify
the most with. As show in figure 2 the ethnic origin ranges from Belgian to Welsh. Additionally the
number of male respondents were 14 whilst the number of female respondents were 20 in the
majority. Moreover, from this group, one respondent has indicated to have a gender identity as non-
binary. Furthermore, two respondents have indicated to be a female transgender and one respondent
has indicated to be a male transgender.
Figure 3 Bar Chart: Survey results Q4
Figure 3 illustrates a bar chart whereby the result of survey have been presented, concerning question
4. In this part of the survey,, the respondents were asked to indicate whether they identify as a person
with a disability. From the Bar chart it can be seen that the majority has indicated to not having a
disability. Additionally the chart also shows that a number of respondents indicated that they might
identify as a person with a disability. Moreover, 1 respondent has indicated to having a mental illness.