Research Methods
Descriptive Statistics, Graphs and Math
Mathematical Content:
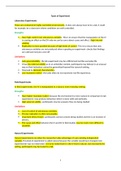
Mathematical Symbols
Calculating percentages:
Number of participants∈Condition A
◦ x 100= ___%
Total number of participants
Percentage to decimals:
◦ Add a 0. before the percentage and drop the % e.g. 60% to 0.60
◦ Move the decimal point, 2 places to the left. e.g. 37% is 37.0 then as a percentage it is 0.37
Decimal to a fraction:
◦ Work out the decimal places and then divide. The number of decimal places will determine
how many 0s e.g. 2 decimal places, divide by 100, or 3 d.p then divide by 1000
◦ You can sometimes simplify and reduce a fraction by finding the Highest Common Factor
(HCF) e.g. 275/1000 is equal to 11/40 as you can divide both by 25 which is the highest
common factor.
Using ratios:
◦ Part-to-whole: No. of participants in Condition A: Total Number of participants
◦ Part- to-part: No. of participants in Condition A: No. of participants in Condition B
Estimate Results
It may also be necessary to comment on the mean or range which may require estimating an
answer. e.g. estimate the range of a data set where the highest number was 322 and the lowest
number was 57. The range is 266.
Using Significant figures:
We can round of a long number to significant figures for clarity. For example, 432,765 rounded to 2
s.f is 430,000. Similarly, when there are many numbers after a decimal point, we can round this off
to 1, 2 or 3 s.f
e.g. 0.003245 to 2 s.f is 0.0032
In case of pi, this is often expressed as 3.142 (4 s.f) rather than 3.142159…
1
, Research Methods
Note: if the final digit is 5 or above, the previous digit is rounded up or is rounded down is the final
digit is less than 5.
Descriptive Statistics
◦ Refers to things like graphs, tables, and summary statistics (e.g. measures of central
tendency and dispersion)
◦ Used to identify and analyse sets of data
◦ Raw scores can be either summarised by:
◦ Measures of central tendency
◦ Measures of dispersion
Measures of Central Tendency
◦ The general term for any measure of the average value in a set of data
◦ Mean- Arithmetic average, add up the scores and dividing N
◦ Median- Middle value when scores are arranged in order.
◦ Mode- Most frequently occurring value. 2 modes are known as BI-MODAL
Measures of Dispersion
◦ Any measure of the spread or variation in a set of scores – how far the scores vary and differ
from one another There are two types:
◦ range
◦ standard deviation
Range- Difference between the highest and lowest value plus 1.
2
Descriptive Statistics, Graphs and Math
Mathematical Content:
Mathematical Symbols
Calculating percentages:
Number of participants∈Condition A
◦ x 100= ___%
Total number of participants
Percentage to decimals:
◦ Add a 0. before the percentage and drop the % e.g. 60% to 0.60
◦ Move the decimal point, 2 places to the left. e.g. 37% is 37.0 then as a percentage it is 0.37
Decimal to a fraction:
◦ Work out the decimal places and then divide. The number of decimal places will determine
how many 0s e.g. 2 decimal places, divide by 100, or 3 d.p then divide by 1000
◦ You can sometimes simplify and reduce a fraction by finding the Highest Common Factor
(HCF) e.g. 275/1000 is equal to 11/40 as you can divide both by 25 which is the highest
common factor.
Using ratios:
◦ Part-to-whole: No. of participants in Condition A: Total Number of participants
◦ Part- to-part: No. of participants in Condition A: No. of participants in Condition B
Estimate Results
It may also be necessary to comment on the mean or range which may require estimating an
answer. e.g. estimate the range of a data set where the highest number was 322 and the lowest
number was 57. The range is 266.
Using Significant figures:
We can round of a long number to significant figures for clarity. For example, 432,765 rounded to 2
s.f is 430,000. Similarly, when there are many numbers after a decimal point, we can round this off
to 1, 2 or 3 s.f
e.g. 0.003245 to 2 s.f is 0.0032
In case of pi, this is often expressed as 3.142 (4 s.f) rather than 3.142159…
1
, Research Methods
Note: if the final digit is 5 or above, the previous digit is rounded up or is rounded down is the final
digit is less than 5.
Descriptive Statistics
◦ Refers to things like graphs, tables, and summary statistics (e.g. measures of central
tendency and dispersion)
◦ Used to identify and analyse sets of data
◦ Raw scores can be either summarised by:
◦ Measures of central tendency
◦ Measures of dispersion
Measures of Central Tendency
◦ The general term for any measure of the average value in a set of data
◦ Mean- Arithmetic average, add up the scores and dividing N
◦ Median- Middle value when scores are arranged in order.
◦ Mode- Most frequently occurring value. 2 modes are known as BI-MODAL
Measures of Dispersion
◦ Any measure of the spread or variation in a set of scores – how far the scores vary and differ
from one another There are two types:
◦ range
◦ standard deviation
Range- Difference between the highest and lowest value plus 1.
2