WEEK 1
MACRO → study of interactions of people and firms through markets
MICRO → Study of individual people and firms through markets
Cost of inflation to society:
• Unexpected and symmetric information
o All prices change by the same amount
• Unexpected and asymmetric information
o Some prices change more than others
o E.g., wage increase is less than the price increase
• Deflation
o Leads to lower consumer spending
o Increases the value of outstanding debt
• Sticky prices
o Some prices don’t adjust as quickly
o Creates distortions and inefficiencies
Covid-19
• Negative effect on GDP
• Education disrupted
• Government measures may be costly in the long run
• V-shaped recoveries
1.2 HOW MACROECONOMCIS STUDIES KEY QUESTIONS
General approach:
1. Document the facts.
2. Develop a model.
3. Compare predictions of the model with original facts.
4. Use the model to make other predictions that will eventually be tested.
Models:
• Simplify
• Good predictive power
• Involve systems of multiple equations
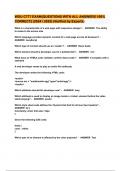
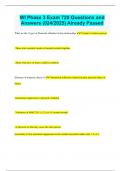
PARAMETER → inputs that are fixed over time except when economists change it for an
experiment
EXOGENOUS → input that can change over time but determined ahead of time. Outside the
model.
ENDOGENOUS → outcome of the model. ‘Within the model’
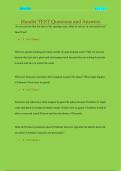
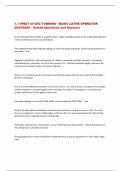
, • Increase in
income tax =
decrease in labour
supply
• Increase in input
price = decrease in
labour demand
• Income tax is an exogenous variable
• Input price is an exogenous variable
o E.g., machinery
1.3 OVERVIEW OF MACROECONOMICS
The long run:
• The analysis of economic growth helps explain the long run
• Long term growth dominates short-run fluctuations
WELFARE → Variable used to determine preferable policies and rank outcomes
• Measuring welfare is highly subjective.
• Increasing GDP (consumption) increases welfare.
• Other variables to consider:
• Leisure, Equality, Life expectancy, Environmental quality, Individual freedom
,PARETO EFFICIENCY → When you cannot make someone better off without making
someone else worse off
Deviations from pareto efficiency and free markets:
• Market power
• Externalities
• Public goods
• Asymmetric (imperfect) information
Why economists disagree:
• Nature of market failures (magnitude)
• Theory of complete and competitive markets breaks down.
• Which Pareto efficient outcome is best?
2.1 INTRODUCTION
National income accounting:
• Method of aggregating the production of diverse goods into a single measure of
overall economic activity
• Total production = total income = total spending
National accounting:
• State of an economy at a given time
• Changes to an economy over time
• Differences across countries
2.2 MEASURING THE STATE OF THE ECONOMY
• GDP → the market value of the final goods and services produced in an economy
over a certain period
Growth rate = (GDPY2-GDPY1)/GDPY1
• PRODUCTION → number of goods produced
• EXPENDITURE → total purchases
• INCOME → all income earned
Expenditure approach
• Y = C + I + G + NX
• Investment:
• Business fixed investment (non-residential aka gross capital formation:
• Spending by firms on plants, machinery, and equipment
• Residential investment also called dwellings investment
• Construction of new houses and apartment buildings
• Inventory investment
• Changes in inventories (of final or intermediate goods)
Income approach:
CAPITAL → Inputs into production other than labour that are not used up in the production
process
• Increased by firms through investment
, DEPRECIATION → The deterioration of the capital stock due to wear and tear
• GDP - depreciation = net domestic product
Share of GDP to labour = 2/3
• remained approximately constant over time
Share of GDP to capital = 1/3
Production approach
• no double counting
• Only final sale of goods and services counts
VALUE ADDED → the amount each producer contributes to GDP
• Revenue generated - value of intermediate products
• Only new production of goods and services counts towards GDP
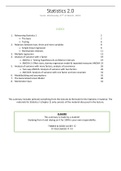
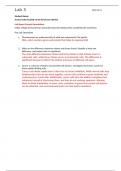
What’s included in GDP?
Included: Not included
Government spending on goods/services Government transfer payments - it isn't a creation of
new wealth it’s just a transfer
Factory production Environmental conditions
Healthcare expenditures A measure of a nation’s health
Ingredients and food purchased Time spent cooking at home
Kids in day care Babysitter - without receipt it’s not part of the formal
economy
• GDP used as a proxy for standards of living
2.3 MEASURING CHANGES OVER TIME
NOMINAL GDP → prices and quantities haven’t been separated, set current prices
• Nominal GDP = price level x real GDP
• Nominal GDP: Yt = P1tQ1t + P2tQ2t + … + PNtQNt
REAL GDP → actual quantity of goods and services, using base year prices
• Real Y = nominal Y ÷ price level
• Real GDP: Yt = P1,t-1Q1t + P2,t-1Q2t+…+PN,t-1QNt in year t-1 prices
2.4 COMPARING ECONOMIC PERFORMANCE ACROSS COUNTRIES
• The exchange rate - prices at which different currencies are traded
• To make comparisons of GDP across countries
o GDP must be expressed in a common currency by first adjusting it by the
exchange rate
o This value of nominal GDP must be multiplied by the ratio of prices in the
countries
• Poor countries tend to have lower prices due to lower wages
STEPS
1. Use the exchange rate to turn A into B
• If exchange rate between A and B is x
• A x 1/x = B
2. Adjust for relative price level of goods
• Real GDP(A)B prices = price level B x (nominal GDP(A)B prices ÷ Price level A)
MACRO → study of interactions of people and firms through markets
MICRO → Study of individual people and firms through markets
Cost of inflation to society:
• Unexpected and symmetric information
o All prices change by the same amount
• Unexpected and asymmetric information
o Some prices change more than others
o E.g., wage increase is less than the price increase
• Deflation
o Leads to lower consumer spending
o Increases the value of outstanding debt
• Sticky prices
o Some prices don’t adjust as quickly
o Creates distortions and inefficiencies
Covid-19
• Negative effect on GDP
• Education disrupted
• Government measures may be costly in the long run
• V-shaped recoveries
1.2 HOW MACROECONOMCIS STUDIES KEY QUESTIONS
General approach:
1. Document the facts.
2. Develop a model.
3. Compare predictions of the model with original facts.
4. Use the model to make other predictions that will eventually be tested.
Models:
• Simplify
• Good predictive power
• Involve systems of multiple equations
PARAMETER → inputs that are fixed over time except when economists change it for an
experiment
EXOGENOUS → input that can change over time but determined ahead of time. Outside the
model.
ENDOGENOUS → outcome of the model. ‘Within the model’
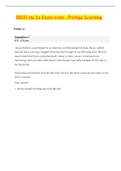
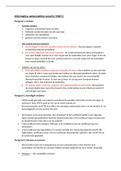
, • Increase in
income tax =
decrease in labour
supply
• Increase in input
price = decrease in
labour demand
• Income tax is an exogenous variable
• Input price is an exogenous variable
o E.g., machinery
1.3 OVERVIEW OF MACROECONOMICS
The long run:
• The analysis of economic growth helps explain the long run
• Long term growth dominates short-run fluctuations
WELFARE → Variable used to determine preferable policies and rank outcomes
• Measuring welfare is highly subjective.
• Increasing GDP (consumption) increases welfare.
• Other variables to consider:
• Leisure, Equality, Life expectancy, Environmental quality, Individual freedom
,PARETO EFFICIENCY → When you cannot make someone better off without making
someone else worse off
Deviations from pareto efficiency and free markets:
• Market power
• Externalities
• Public goods
• Asymmetric (imperfect) information
Why economists disagree:
• Nature of market failures (magnitude)
• Theory of complete and competitive markets breaks down.
• Which Pareto efficient outcome is best?
2.1 INTRODUCTION
National income accounting:
• Method of aggregating the production of diverse goods into a single measure of
overall economic activity
• Total production = total income = total spending
National accounting:
• State of an economy at a given time
• Changes to an economy over time
• Differences across countries
2.2 MEASURING THE STATE OF THE ECONOMY
• GDP → the market value of the final goods and services produced in an economy
over a certain period
Growth rate = (GDPY2-GDPY1)/GDPY1
• PRODUCTION → number of goods produced
• EXPENDITURE → total purchases
• INCOME → all income earned
Expenditure approach
• Y = C + I + G + NX
• Investment:
• Business fixed investment (non-residential aka gross capital formation:
• Spending by firms on plants, machinery, and equipment
• Residential investment also called dwellings investment
• Construction of new houses and apartment buildings
• Inventory investment
• Changes in inventories (of final or intermediate goods)
Income approach:
CAPITAL → Inputs into production other than labour that are not used up in the production
process
• Increased by firms through investment
, DEPRECIATION → The deterioration of the capital stock due to wear and tear
• GDP - depreciation = net domestic product
Share of GDP to labour = 2/3
• remained approximately constant over time
Share of GDP to capital = 1/3
Production approach
• no double counting
• Only final sale of goods and services counts
VALUE ADDED → the amount each producer contributes to GDP
• Revenue generated - value of intermediate products
• Only new production of goods and services counts towards GDP
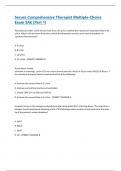
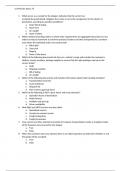
What’s included in GDP?
Included: Not included
Government spending on goods/services Government transfer payments - it isn't a creation of
new wealth it’s just a transfer
Factory production Environmental conditions
Healthcare expenditures A measure of a nation’s health
Ingredients and food purchased Time spent cooking at home
Kids in day care Babysitter - without receipt it’s not part of the formal
economy
• GDP used as a proxy for standards of living
2.3 MEASURING CHANGES OVER TIME
NOMINAL GDP → prices and quantities haven’t been separated, set current prices
• Nominal GDP = price level x real GDP
• Nominal GDP: Yt = P1tQ1t + P2tQ2t + … + PNtQNt
REAL GDP → actual quantity of goods and services, using base year prices
• Real Y = nominal Y ÷ price level
• Real GDP: Yt = P1,t-1Q1t + P2,t-1Q2t+…+PN,t-1QNt in year t-1 prices
2.4 COMPARING ECONOMIC PERFORMANCE ACROSS COUNTRIES
• The exchange rate - prices at which different currencies are traded
• To make comparisons of GDP across countries
o GDP must be expressed in a common currency by first adjusting it by the
exchange rate
o This value of nominal GDP must be multiplied by the ratio of prices in the
countries
• Poor countries tend to have lower prices due to lower wages
STEPS
1. Use the exchange rate to turn A into B
• If exchange rate between A and B is x
• A x 1/x = B
2. Adjust for relative price level of goods
• Real GDP(A)B prices = price level B x (nominal GDP(A)B prices ÷ Price level A)