3.2.4.2 Environment and population
Global and regional patterns of food production and consumption
Nutrition is fundamental in determining both our capacity to work and our quality of life, not least
our susceptibility to illness and capacity for recovery. It increases the incidence, severity and
duration of diseases. Yet geographically, patterns of food production and consumption demonstrate
remarkable contrasts. The FAO estimated that in 2014-16 one in nine (780 million) of the global
population were suffering from chronic undernourishment – and that almost all of these lived in
developing countries. Two-thirds of this total live in Asia, yet sub-Saharan Africa is the region with
the highest percentage – one in four is undernourished.
According to the FAO, undernourishment, or hunger, is dietary intake below the minimum daily
energy requirement. Dietary requirements differ by age and gender, and for different levels of
physical activity. The amount of undernourishment is calculated using the average amount of food
available for consumption, the size of the population, the relative disparities in access to the food,
and the minimum calories required for each individual. Undernourishment has decreased across the
world since 1990, in all regions except Africa, where it has steadily increased.
The decrease in undernourishment has not quite been able to reach the Millennium Development
Goal of halving hunger between 1990 and 2015. The global financial, economic and food-price crisis
in 2008 drove many people to hunger, especially women and children. The sudden increase in food
prices prevented many people from escaping poverty, because the poor spend a larger proportion of
their income on food and subsistence farmers are net consumers of food.
In the early 1960s, global food supplies for humans stood at only 2300 calories per person per day,
this was very unevenly distributed. In high-income countries the average was 3030 calories per day,
whereas in low-income countries of the developing world it was below 2000. Probably more than
half of these people suffered chronic under-nutrition.
Food supply increased in all regions of the world in the period 2000 to 2008 but the rates of increase
vary. LICs in areas such as Africa have seen higher growth rates than HICs. This is a result of higher
population growth rates and therefore increasing demand. Slower growth rates or even slight
decline in richer countries due to high per capita consumption.
By 2010, although global population had increased by almost two and a half times, the world could
produce enough food to provide every person with more than 2800 calories per day. This should
have been sufficient to ensure that all had enough to eat but unfortunately, food production and
availability was uneven, (poverty – price of food goes up in times of shortage) meaning that 800
million people still suffered from under-nutrition. This, however, represents a drop in overall
percentage from 50 to 20%.
These gains resulted from a number of factors:
- The package of technologies referred to as the green revolution, including increased use of
new, high-yielding crop varieties and technologies. Irrigation, fertiliser and pesticides
increased yields for millions of farmers, although with some negative social and
environmental impacts.
- An increased reliance on global trade. During the 1970s alone, net imports of cereals by LICs
more than tripled – from 20 million to 67 million tonnes.
,Malnutrition:
- Undernourishment is the most common expression of malnutrition in the form of
undernutrition - both protein-energy malnutrition (lack of calories and protein) and also
micronutrient (vitamin and mineral) deficiency.
- Overnutrition – eating too much is now a more serious health risk than eating poorly. In
2014, more than 1.9 billion adults were overweight – over 600 million were obese. This can
lead to heart disease, stroke, diabetes and certain cancers. These risks are increased by low
levels of physical activity and tobacco use.
Good nutrition is a foundation for many development goals, especially for those relating to health,
education, gender equality and poverty alleviation. Europe, North America and Australasia have
enough farmland to provide the food they need, with significant surpluses to export. In contrast, half
of all LICs lack sufficient farmland and technology to be self-sufficient and are too poor to import.
Niger, Ethiopia, Yemen and Madagascar in Africa and India, Nepal, Bangladesh, Cambodia and Laos
in Asia have a higher number of underweight children.
One-third of food produced worldwide is still wasted, so one in four calories produced for
consumption is never eaten. Undernutrition will persist until food is more evenly distributed and
waste reduced. There is a close link between poverty and lack of nutrition.
Changes in global meat production
Total meat production has increased from about 225 million tonnes to about 290 million tonnes, an
increase of about 65 million tonnes. The production of beef and buffalo meat has remained fairly
steady, increasing only slightly between 2000 and 2010. The same for sheep and goat meat which
also remains the smallest category of meat produced. Poultry is the second largest category and has
increased by about 11% between 2000 and 2010. The biggest production of meat is pig meat (but
only just) and this has also increased by about 10%.
As countries become wealthier, diet changes from predominantly grain based and vegetables to a
more ‘westernised’ diet including increased meat consumption. Poultry and pork are the cheapest
meats to produce/purchase and this could account for the increase in their production. In some
wealthier countries, particularly in Europe, there have been health concerns regarding red meat
consumption, which is also relatively more expensive to produce/ purchase. There have been horse
meat scandals, mad cow disease (which could then get into the food chain via the meat) and health
worries and links to diseases such as heart disease.
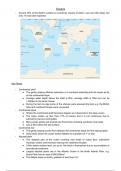
Case study – Niger, North Africa
According to the UN’s Human Development Index (2015), Niger, in the Sahel region of Africa, is the
poorest country on the planet. It is a LIC with an agriculture-based economy. The country also has
the highest total fertility rate (at nearly 7 births per woman). It would be too simplistic to regard
poverty alone as the explanation for the high population growth rate.
Niger is a landlocked country that is mostly desert. Northern areas of Niger typically receive only
around 200mm of rain each year. Rainfall increases in the SW, with the majority of rain (600mm)
falling between May and September. Over the last 50 years, rainfall has been declining and droughts
(and subsequent food shortages) are common. This means crops die and animals can’t graze, which
leads to famine. Furthermore, underdeveloped infrastructure means that during times of crises,
food aid cannot be distributed without difficulties (including overseas).
,In the absence of real political will to invest in irrigation systems, planting of crops tends to be
limited to the more fertile soils of the south bordering Lake Chad and the River Niger. Elsewhere,
subsistence farming dominates on the dry, dusty and nutrient-deficient soils, particularly the
nomadic (moving from one place to another) herding of cattle, sheep and goats. However,
overgrazing (which can lead to desertification) and loss of cattle during drought periods have forced
farmers and their families to give up this traditional method of farming and move to the towns to
find work. Larger family sizes are both a cultural norm (polygamy is common and competition exists
between some wives to have larger families) and also considered as an economic necessity for
subsistence farmers as children can work on the land at a young age and earn money from jobs as
they get older. Niger cannot feed itself alone – around 2.5 million people have no guaranteed source
of food - they’re food insecure.
Niger has begun to tackle the problem of food security. In 2012 a government initiative called 3N
(Nigeriens Nourish Nigeriens) led to the use of improved seed varieties, better irrigation and the
transfer of surplus milk from the north to the south of the country. Food insecurity has decreased
and Niger’s GDP growth, which is driven by agriculture, increased from 4.1% in 2013 to 7.1% in 2014.
An oversize epidemic?
Worldwide obesity has more than doubled since 1980 – 39% of adults were overweight in 2014 (13%
were obese) and 41 million children under the age of five were either overweight or obese. Yet
obesity is preventable.
The fundamental cause of overweight and obesity is eating too many calories and not getting
sufficient physical activity. Globally, there has been:
- An increased intake of energy-dense foods, particularly those high in fat, sugar and salt, for
example fast food. E.g. 100g of chocolate provides 10 times the calories of 100g of apple.
- Growth in powerful food corporations who push cheap, energy dense foods.
- An increase in physical inactivity due to the increasingly sedentary nature of many forms of
work and leisure activities, changing modes of transportation and increasing urbanisation. A
lack of roads, transport and facilities, and the presence of danger, crime, injury and disability
limit people’s ability to exercise.
- Increase in TV and computer games for entertainment – more sedentary lifestyles.
- Incomes rising – can afford to buy more food.
- But once the nutrition transition has taken place, low income households eat more of the
energy-dense, cheaper foods available.
- In cities, fresh and fruit and veg are comparatively more expensive.
- Eating out is no longer a treat but carried out several times a week – processed, energy
dense foods dominate such as burgers and pizzas.
- Influence of advertising – TV, newspapers, etc.
- Urban setting – ease of access to public transport. Increase in car ownership leads to less
walking.
- Meat and meat products becoming increasingly important components of the diet.
- Larger meal portions become the norm.
- Cheaper fats and oils become available.
- More women in the workforce outside home – more eating out, less home cooking.
The health consequences of being overweight, particularly obesity, are often discussed in the
context of ‘diseases of affluence’ associate with over-indulgence and the pressured way of life in
HICs. But it can be difficult to have a balanced diet on a low income - many obese people are low-
, income earners, with imbalanced diets dominated by cheap carbohydrates and/ or convenient
micronutrient-poor processed foods. It is therefore inadvisable, and insensitive, to generalise.
An obesogenic environment is one which seems to encourage a tendency to obesity by encouraging
the uptake of energy dense foods such as at fast food outlets.
The socio-economic, age and even race variables associated with over-nutrition are found
worldwide. Furthermore, many LICs and NEEs continue to deal with the problems of infectious
diseases and undernourishment, while they are also experiencing a rapid upsurge in non-
communicable disease risk factors related to obesity and overweight, particularly in urban areas
including coronary heart, liver and gallbladder disease, type 2 diabetes, cancers, high blood pressure
and stroke. Also, people who are overweight or obese take more sick days thus impacting on the
efficiency of businesses. All the above health problems are likely to require treatment and so are
forming an increasing burden on health services. It has been estimated that the present generation
under 25 will be the first in the West not to see an improvement in their life expectancy, so great is
the threat of obesity to a nation’s health.
The Nutrition Transition
How we access nutrition changes as our societies develop economically. The ‘Nutrition Transition’ is
the process by which a country moves away from a local diet of traditional foodstuff towards a
reliance on dairy products and meat and the energy dense foodstuffs associated with processed
foods, fast food outlets etc. This leads to increasing levels of being overweight and obesity, and
usually coincides with large scale rural-urban migration. A further stage is that with better education
and a higher income, we can move on to a balanced diet, but with perhaps more certainty than
when at the first stage, that there will be enough food. Obesity is associated with the middle stage.
Stage 1 - Traditional Stage 2 – Energy dense Stage 3 -Educated nutrition
Fluctuating but usually lower Peak of calorie intake Controlled calorie intake
calorie intake
Usually limited income Improved income Steady income
Home cooked and locally Likely to have migrated to Ability to choose to eat more
sourced food urban from rural area healthily
A society with much physical Less cereal and fewer Educated in value of nutrition
work traditional foodstuffs
Cereals are important More meat in diet as well as Lower intake of calories as jobs
component of diet oils and fats are less physically arduous
Very little meat or dairy Eating out is a regular Increases in eating of
occurrence – partially due to vegetables, fruit and local
increased income but also cereal
because women are working
outside home so less time for
cooking
Eating out rare Snacking on foods high in Increased government
sugars, salts and fats is initiatives on diet
common
Very limited access to Daily calorie intake increases Amount of meat eaten likely to
processed foods fall
Likely to have mineral/ vitamin Obesity becomes a problem Eating out is a treat – at local
deficiencies restaurants – not fast food
Global and regional patterns of food production and consumption
Nutrition is fundamental in determining both our capacity to work and our quality of life, not least
our susceptibility to illness and capacity for recovery. It increases the incidence, severity and
duration of diseases. Yet geographically, patterns of food production and consumption demonstrate
remarkable contrasts. The FAO estimated that in 2014-16 one in nine (780 million) of the global
population were suffering from chronic undernourishment – and that almost all of these lived in
developing countries. Two-thirds of this total live in Asia, yet sub-Saharan Africa is the region with
the highest percentage – one in four is undernourished.
According to the FAO, undernourishment, or hunger, is dietary intake below the minimum daily
energy requirement. Dietary requirements differ by age and gender, and for different levels of
physical activity. The amount of undernourishment is calculated using the average amount of food
available for consumption, the size of the population, the relative disparities in access to the food,
and the minimum calories required for each individual. Undernourishment has decreased across the
world since 1990, in all regions except Africa, where it has steadily increased.
The decrease in undernourishment has not quite been able to reach the Millennium Development
Goal of halving hunger between 1990 and 2015. The global financial, economic and food-price crisis
in 2008 drove many people to hunger, especially women and children. The sudden increase in food
prices prevented many people from escaping poverty, because the poor spend a larger proportion of
their income on food and subsistence farmers are net consumers of food.
In the early 1960s, global food supplies for humans stood at only 2300 calories per person per day,
this was very unevenly distributed. In high-income countries the average was 3030 calories per day,
whereas in low-income countries of the developing world it was below 2000. Probably more than
half of these people suffered chronic under-nutrition.
Food supply increased in all regions of the world in the period 2000 to 2008 but the rates of increase
vary. LICs in areas such as Africa have seen higher growth rates than HICs. This is a result of higher
population growth rates and therefore increasing demand. Slower growth rates or even slight
decline in richer countries due to high per capita consumption.
By 2010, although global population had increased by almost two and a half times, the world could
produce enough food to provide every person with more than 2800 calories per day. This should
have been sufficient to ensure that all had enough to eat but unfortunately, food production and
availability was uneven, (poverty – price of food goes up in times of shortage) meaning that 800
million people still suffered from under-nutrition. This, however, represents a drop in overall
percentage from 50 to 20%.
These gains resulted from a number of factors:
- The package of technologies referred to as the green revolution, including increased use of
new, high-yielding crop varieties and technologies. Irrigation, fertiliser and pesticides
increased yields for millions of farmers, although with some negative social and
environmental impacts.
- An increased reliance on global trade. During the 1970s alone, net imports of cereals by LICs
more than tripled – from 20 million to 67 million tonnes.
,Malnutrition:
- Undernourishment is the most common expression of malnutrition in the form of
undernutrition - both protein-energy malnutrition (lack of calories and protein) and also
micronutrient (vitamin and mineral) deficiency.
- Overnutrition – eating too much is now a more serious health risk than eating poorly. In
2014, more than 1.9 billion adults were overweight – over 600 million were obese. This can
lead to heart disease, stroke, diabetes and certain cancers. These risks are increased by low
levels of physical activity and tobacco use.
Good nutrition is a foundation for many development goals, especially for those relating to health,
education, gender equality and poverty alleviation. Europe, North America and Australasia have
enough farmland to provide the food they need, with significant surpluses to export. In contrast, half
of all LICs lack sufficient farmland and technology to be self-sufficient and are too poor to import.
Niger, Ethiopia, Yemen and Madagascar in Africa and India, Nepal, Bangladesh, Cambodia and Laos
in Asia have a higher number of underweight children.
One-third of food produced worldwide is still wasted, so one in four calories produced for
consumption is never eaten. Undernutrition will persist until food is more evenly distributed and
waste reduced. There is a close link between poverty and lack of nutrition.
Changes in global meat production
Total meat production has increased from about 225 million tonnes to about 290 million tonnes, an
increase of about 65 million tonnes. The production of beef and buffalo meat has remained fairly
steady, increasing only slightly between 2000 and 2010. The same for sheep and goat meat which
also remains the smallest category of meat produced. Poultry is the second largest category and has
increased by about 11% between 2000 and 2010. The biggest production of meat is pig meat (but
only just) and this has also increased by about 10%.
As countries become wealthier, diet changes from predominantly grain based and vegetables to a
more ‘westernised’ diet including increased meat consumption. Poultry and pork are the cheapest
meats to produce/purchase and this could account for the increase in their production. In some
wealthier countries, particularly in Europe, there have been health concerns regarding red meat
consumption, which is also relatively more expensive to produce/ purchase. There have been horse
meat scandals, mad cow disease (which could then get into the food chain via the meat) and health
worries and links to diseases such as heart disease.
Case study – Niger, North Africa
According to the UN’s Human Development Index (2015), Niger, in the Sahel region of Africa, is the
poorest country on the planet. It is a LIC with an agriculture-based economy. The country also has
the highest total fertility rate (at nearly 7 births per woman). It would be too simplistic to regard
poverty alone as the explanation for the high population growth rate.
Niger is a landlocked country that is mostly desert. Northern areas of Niger typically receive only
around 200mm of rain each year. Rainfall increases in the SW, with the majority of rain (600mm)
falling between May and September. Over the last 50 years, rainfall has been declining and droughts
(and subsequent food shortages) are common. This means crops die and animals can’t graze, which
leads to famine. Furthermore, underdeveloped infrastructure means that during times of crises,
food aid cannot be distributed without difficulties (including overseas).
,In the absence of real political will to invest in irrigation systems, planting of crops tends to be
limited to the more fertile soils of the south bordering Lake Chad and the River Niger. Elsewhere,
subsistence farming dominates on the dry, dusty and nutrient-deficient soils, particularly the
nomadic (moving from one place to another) herding of cattle, sheep and goats. However,
overgrazing (which can lead to desertification) and loss of cattle during drought periods have forced
farmers and their families to give up this traditional method of farming and move to the towns to
find work. Larger family sizes are both a cultural norm (polygamy is common and competition exists
between some wives to have larger families) and also considered as an economic necessity for
subsistence farmers as children can work on the land at a young age and earn money from jobs as
they get older. Niger cannot feed itself alone – around 2.5 million people have no guaranteed source
of food - they’re food insecure.
Niger has begun to tackle the problem of food security. In 2012 a government initiative called 3N
(Nigeriens Nourish Nigeriens) led to the use of improved seed varieties, better irrigation and the
transfer of surplus milk from the north to the south of the country. Food insecurity has decreased
and Niger’s GDP growth, which is driven by agriculture, increased from 4.1% in 2013 to 7.1% in 2014.
An oversize epidemic?
Worldwide obesity has more than doubled since 1980 – 39% of adults were overweight in 2014 (13%
were obese) and 41 million children under the age of five were either overweight or obese. Yet
obesity is preventable.
The fundamental cause of overweight and obesity is eating too many calories and not getting
sufficient physical activity. Globally, there has been:
- An increased intake of energy-dense foods, particularly those high in fat, sugar and salt, for
example fast food. E.g. 100g of chocolate provides 10 times the calories of 100g of apple.
- Growth in powerful food corporations who push cheap, energy dense foods.
- An increase in physical inactivity due to the increasingly sedentary nature of many forms of
work and leisure activities, changing modes of transportation and increasing urbanisation. A
lack of roads, transport and facilities, and the presence of danger, crime, injury and disability
limit people’s ability to exercise.
- Increase in TV and computer games for entertainment – more sedentary lifestyles.
- Incomes rising – can afford to buy more food.
- But once the nutrition transition has taken place, low income households eat more of the
energy-dense, cheaper foods available.
- In cities, fresh and fruit and veg are comparatively more expensive.
- Eating out is no longer a treat but carried out several times a week – processed, energy
dense foods dominate such as burgers and pizzas.
- Influence of advertising – TV, newspapers, etc.
- Urban setting – ease of access to public transport. Increase in car ownership leads to less
walking.
- Meat and meat products becoming increasingly important components of the diet.
- Larger meal portions become the norm.
- Cheaper fats and oils become available.
- More women in the workforce outside home – more eating out, less home cooking.
The health consequences of being overweight, particularly obesity, are often discussed in the
context of ‘diseases of affluence’ associate with over-indulgence and the pressured way of life in
HICs. But it can be difficult to have a balanced diet on a low income - many obese people are low-
, income earners, with imbalanced diets dominated by cheap carbohydrates and/ or convenient
micronutrient-poor processed foods. It is therefore inadvisable, and insensitive, to generalise.
An obesogenic environment is one which seems to encourage a tendency to obesity by encouraging
the uptake of energy dense foods such as at fast food outlets.
The socio-economic, age and even race variables associated with over-nutrition are found
worldwide. Furthermore, many LICs and NEEs continue to deal with the problems of infectious
diseases and undernourishment, while they are also experiencing a rapid upsurge in non-
communicable disease risk factors related to obesity and overweight, particularly in urban areas
including coronary heart, liver and gallbladder disease, type 2 diabetes, cancers, high blood pressure
and stroke. Also, people who are overweight or obese take more sick days thus impacting on the
efficiency of businesses. All the above health problems are likely to require treatment and so are
forming an increasing burden on health services. It has been estimated that the present generation
under 25 will be the first in the West not to see an improvement in their life expectancy, so great is
the threat of obesity to a nation’s health.
The Nutrition Transition
How we access nutrition changes as our societies develop economically. The ‘Nutrition Transition’ is
the process by which a country moves away from a local diet of traditional foodstuff towards a
reliance on dairy products and meat and the energy dense foodstuffs associated with processed
foods, fast food outlets etc. This leads to increasing levels of being overweight and obesity, and
usually coincides with large scale rural-urban migration. A further stage is that with better education
and a higher income, we can move on to a balanced diet, but with perhaps more certainty than
when at the first stage, that there will be enough food. Obesity is associated with the middle stage.
Stage 1 - Traditional Stage 2 – Energy dense Stage 3 -Educated nutrition
Fluctuating but usually lower Peak of calorie intake Controlled calorie intake
calorie intake
Usually limited income Improved income Steady income
Home cooked and locally Likely to have migrated to Ability to choose to eat more
sourced food urban from rural area healthily
A society with much physical Less cereal and fewer Educated in value of nutrition
work traditional foodstuffs
Cereals are important More meat in diet as well as Lower intake of calories as jobs
component of diet oils and fats are less physically arduous
Very little meat or dairy Eating out is a regular Increases in eating of
occurrence – partially due to vegetables, fruit and local
increased income but also cereal
because women are working
outside home so less time for
cooking
Eating out rare Snacking on foods high in Increased government
sugars, salts and fats is initiatives on diet
common
Very limited access to Daily calorie intake increases Amount of meat eaten likely to
processed foods fall
Likely to have mineral/ vitamin Obesity becomes a problem Eating out is a treat – at local
deficiencies restaurants – not fast food