Topic:Topic/Skill Definition/Tips
Coordinates and Linear Graphs Example
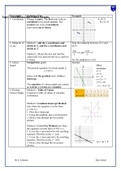
1. Coordinates Written in pairs. The first term is the x- A: (4,7)
coordinate (movement across). The B: (-6,-3)
second term is the y-coordinate
(movement up or down)
2. Midpoint of Method 1: add the x coordinates and Find the midpoint between (2,1) and
a Line divide by 2, add the y coordinates and (6,9)
divide by 2
2+ 6 1+ 9
=4 and =5
Method 2: Sketch the line and find the 2 2
values half way between the two x and two
y values. So, the midpoint is (4,5)
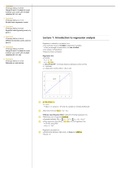
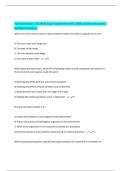
3. Linear Straight line graph. Example:
Graph Other
The general equation of a linear graph is examples:
y=mx+c x= y
y=4
where m is the gradient and c is the y- x=−2
intercept. y=2 x−7
y + x=10
The equation of a linear graph can contain
2 y−4 x=12
an x-term, a y-term and a number.
4. Plotting Method 1: Table of Values
Linear Graphs Construct a table of values to calculate
coordinates.
Method 2: Gradient-Intercept Method
(use when the equation is in the form
y=mx+c )
1. Plots the y-intercept
2. Using the gradient, plot a second point.
3. Draw a line through the two points
plotted.
Method 3: Cover-Up Method (use when
the equation is in the form ax +by =c )
1. Cover the x term and solve the resulting
equation. Plot this on the x−axis .
2. Cover the y term and solve the resulting
equation. Plot this on the y−axis .
3. Draw a line through the two points
plotted.
Mr A. Coleman Glyn School
Coordinates and Linear Graphs Example
1. Coordinates Written in pairs. The first term is the x- A: (4,7)
coordinate (movement across). The B: (-6,-3)
second term is the y-coordinate
(movement up or down)
2. Midpoint of Method 1: add the x coordinates and Find the midpoint between (2,1) and
a Line divide by 2, add the y coordinates and (6,9)
divide by 2
2+ 6 1+ 9
=4 and =5
Method 2: Sketch the line and find the 2 2
values half way between the two x and two
y values. So, the midpoint is (4,5)
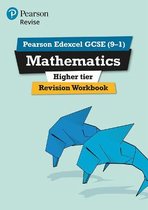
3. Linear Straight line graph. Example:
Graph Other
The general equation of a linear graph is examples:
y=mx+c x= y
y=4
where m is the gradient and c is the y- x=−2
intercept. y=2 x−7
y + x=10
The equation of a linear graph can contain
2 y−4 x=12
an x-term, a y-term and a number.
4. Plotting Method 1: Table of Values
Linear Graphs Construct a table of values to calculate
coordinates.
Method 2: Gradient-Intercept Method
(use when the equation is in the form
y=mx+c )
1. Plots the y-intercept
2. Using the gradient, plot a second point.
3. Draw a line through the two points
plotted.
Method 3: Cover-Up Method (use when
the equation is in the form ax +by =c )
1. Cover the x term and solve the resulting
equation. Plot this on the x−axis .
2. Cover the y term and solve the resulting
equation. Plot this on the y−axis .
3. Draw a line through the two points
plotted.
Mr A. Coleman Glyn School