Topic/Skill
: Histograms Definition/Tips
and Cumulative Frequency Example
1. Histograms A visual way to display frequency data
using bars.
Bars can be unequal in width.
Histograms show frequency density on the
y-axis, not frequency.
Frequency
Frequency Density=
Class Width
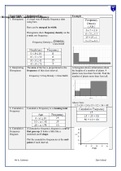
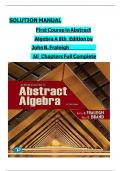
2. Interpreting The area of the bar is proportional to the A histogram shows information about
Histograms frequency of that class interval. the heights of a number of plants. 4
plants were less than 5cm tall. Find the
Frequency=Freq Density × ClassWidth number of plants more than 5cm tall.
Above 5cm:
1.2 x 10 + 2.4 x 15 = 12 + 36 = 48
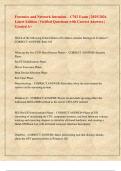
3. Cumulative Cumulative Frequency is a running total.
Frequency
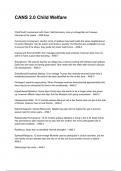
4. Cumulative A cumulative frequency diagram is a curve
Frequency that goes up. It looks a little like a
Diagram stretched-out S shape.
Plot the cumulative frequencies at the end-
point of each interval.
Mr A. Coleman Glyn School
: Histograms Definition/Tips
and Cumulative Frequency Example
1. Histograms A visual way to display frequency data
using bars.
Bars can be unequal in width.
Histograms show frequency density on the
y-axis, not frequency.
Frequency
Frequency Density=
Class Width
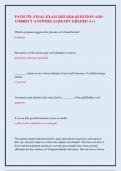
2. Interpreting The area of the bar is proportional to the A histogram shows information about
Histograms frequency of that class interval. the heights of a number of plants. 4
plants were less than 5cm tall. Find the
Frequency=Freq Density × ClassWidth number of plants more than 5cm tall.
Above 5cm:
1.2 x 10 + 2.4 x 15 = 12 + 36 = 48
3. Cumulative Cumulative Frequency is a running total.
Frequency
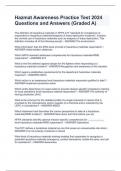
4. Cumulative A cumulative frequency diagram is a curve
Frequency that goes up. It looks a little like a
Diagram stretched-out S shape.
Plot the cumulative frequencies at the end-
point of each interval.
Mr A. Coleman Glyn School