Answers to Review Exercises
Part I. Design of Experiments
Chapter 2. Observational Studies
1. (a) Too hasty. What about population size?
Comments: Michigan may include the big bad city, but Minnesota has
twice the population of Michigan. The crime rate is lower in Michigan. (Of
course, there probably are neighborhoods in Detroit that are best avoided.)
(b) This is better reasoning, because the population of the U.S. increased over
the period 1991–2001. Looking at rates would make the point even more
clearly. (In fact, there has been a remarkable decline in crime rates over
the period 1980–2005.)
2. (a) What’s missing is the number of cars on the road, and there were a lot more
Corvettes. (For example, 33,586 Corvettes were sold in 2002, versus 8,065
Q45s.) You need to look at rates. If anything, thieves prefer the Q45—a
much classier car.
(b) Same issue as (a).
(c) False. The rate is low because the denominator is large relative to the
numerator. The rate compares the number of jeeps stolen to the number
sold. That’s the point of using a rate.
3. No. In the Salk trial, the parents who consented were on the whole better off
than the parents who did not consent, and their children were more at risk to
begin with (p.4).
4. (a) They were controlling for age and sex as possible confounders; this is
discussed on p.13, with respect to a specific disease—lung cancer.
(b) This is the wrong conclusion to draw. Ex-smokers are a self-selected group,
and many people give up smoking because they are sick. So recent ex-
smokers include a lot of sick people. (Other epidemiological data show
that if you quit smoking, you will live longer.)
5. No. The data from the double-blind study are more reliable, and suggest that
the results from the single-blind were biased.
6. Subjects who did not improve during the first part of the trial probably concluded
that they were on the placebo (whether they were or they weren’t) and would
be switched to the “real” medication during the second part of the trial. This
expectation made them improve—the placebo effect.
,Answers to Review Exercises 45
7. (a) This is an observational study, so confounding may be a problem.
(b) Rates of cervical cancer go up with age. Women of different marital status
have different patterns of sexual activity, and are therefore exposed to dif-
ferent kinds of risk; similarly for education. In other words, age, marital
status, and education are potential confounders.
(c) Pill users are more active sexually than non-users, and have more partners.
That seems to be what makes the rate of cervical cancer higher among pill
users. (This is like example 2 on p. 16 or exercise 11 on p. 23.)
(d) No; see (c).
8. Memorial Day is at the end of May; Labor Day is early in September. Just over
25% of the days of the year fall in between. Even if burglars work the same
amount every day, over 25% of the burglaries would occur between Memorial
Day and Labor Day.
9. (a) False. (b) True. (c) False: that is the whole point of experiments.
Discussion. People who eat lots of fruits and vegetables are different from the
rest of us in many other ways. Some other aspect of diet or life style may be
protective. Of course, the observational studies might be right; something in
the fruits and vegetables other than the vitamins might be the protective factor.
10. (a) Observational study. (b) Yes. (c) Yes.
(d) No. The gene would also have to be associated with controlling behavior
by the mother (p.20).
(e) A mother who sees her child eat too much might respond in a way that
psychologists would interpret as “controlling”—Johnny, stop eating!
(f) No. The Chronicle seems to have over-reacted.
11. (a) The treatment group consists of those who finished boot camp. The control
group consists of other prisoners—including those who do not volunteer,
or those who volunteer but do not complete the program.
(b) This is observational. The prisoners decide whether to volunteer for boot
camp and whether to stay in the program or drop out. That is the problem:
those who volunteer and stay the course might be quite different from who
volunteer but drop out.
(c) False.
Comment. An experiment could be done either like the polio trial (p. 1ff) or the
HIP trial (exercise 9 on pp.22–23):
Like the polio trial. Ask for volunteers. Randomize some of the volunteers
to treatment (assignment to boot camp) and some to control. Compare
the recidivism rate for the two groups—but include the dropouts in the
treatment group. (Otherwise, you still have the problem of self-selection.)
,46 Chapter 2
Like the HIP trial. Take a group of prisoners. Randomize some to treatment
(invitation to participate in boot camp) and some to control. Compare the
recidivism rate for the two groups—but include in the treatment group those
who decline to participate and those who drop out. (Again, this is to guard
against the problem of self-selection.)
12. False. The conclusion does not follow. This is just like the admissions study
(pp. 17ff). The Democrats may be concentrated in wards with low turnouts.
Here is an example, with only two wards (and see exercise 13 on p. 24).
DEMOCRATS REPUBLICANS
Total number Number voting Total number Number voting
Ward A 1000 100 100 5
Ward B 100 60 1000 500
Part II. Descriptive Statistics
Chapter 3. The Histogram
1. 66 inches, 72 inches.
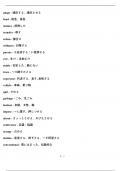
2. (a) There are more at age 1. The histogram is higher at 1 than at 71.
(b) There are more at age 21.
(c) There are more age 0–4,
(d) 50%
Histogram for review exercise 2, chapter 3
2
1
0
0 10 20 30 40 50 60 70 80
AGE (YEARS)
3. (a) Rounding.
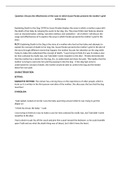
(b) No. Taking percentages adjusts for the difference between the total num-
bers. On the whole, rental units tend to be smaller.
(c) Rental units are smaller, as noted above.
, Answers to Review Exercises 47
Histograms for review exercise 3, chapter 3
(The histogram for owners is shifted to the right)
Rent
40 Own
30
20
10
0
0 1 2 3 4 5 6 7 8 9 10 11 12
NUMBER OF ROOMS
4. (a) 25% (b) 99% (c) 140–150 mm (d) 135–140 mm
(e) About 5 × 2.1 = 10.5% (f) 102–103 mm
(g) 117–118 mm is a good guess; the interval is somewhere between 115 and
120 mm.
5. $10 thousand × 1% per thousand dollars = 10%.
6. (i) and (ii) not (iii).
Reason: With lists (i) and (ii), 25% of the people have heights between 66.5
inches and 67.5 inches; 50% between 67.5 and 68.5 inches; 25% between 68.5
and 69.5 inches. Not so with list (iii).
7. (i) Natural causes. (ii) Trauma.
Reason: Young people die of accidents, murder, etc. Old people die of heart
disease, cancer, etc.
8. (a) is true, (b) and (c) are false. The figure does not adjust for the different
lengths of the class intervals, and is misleading for that reason.
9. (a) True. (b) True.
(c) People with failing GPAs may round them up; and 2 is such an important
number—for GPAs—that people with GPAs just above 2 may round them
down.
10. (a) The histogram is shown below.
20 1880
1970
10
0
0 1 2 3 4 5 6 7 8 9
DIGIT
Part I. Design of Experiments
Chapter 2. Observational Studies
1. (a) Too hasty. What about population size?
Comments: Michigan may include the big bad city, but Minnesota has
twice the population of Michigan. The crime rate is lower in Michigan. (Of
course, there probably are neighborhoods in Detroit that are best avoided.)
(b) This is better reasoning, because the population of the U.S. increased over
the period 1991–2001. Looking at rates would make the point even more
clearly. (In fact, there has been a remarkable decline in crime rates over
the period 1980–2005.)
2. (a) What’s missing is the number of cars on the road, and there were a lot more
Corvettes. (For example, 33,586 Corvettes were sold in 2002, versus 8,065
Q45s.) You need to look at rates. If anything, thieves prefer the Q45—a
much classier car.
(b) Same issue as (a).
(c) False. The rate is low because the denominator is large relative to the
numerator. The rate compares the number of jeeps stolen to the number
sold. That’s the point of using a rate.
3. No. In the Salk trial, the parents who consented were on the whole better off
than the parents who did not consent, and their children were more at risk to
begin with (p.4).
4. (a) They were controlling for age and sex as possible confounders; this is
discussed on p.13, with respect to a specific disease—lung cancer.
(b) This is the wrong conclusion to draw. Ex-smokers are a self-selected group,
and many people give up smoking because they are sick. So recent ex-
smokers include a lot of sick people. (Other epidemiological data show
that if you quit smoking, you will live longer.)
5. No. The data from the double-blind study are more reliable, and suggest that
the results from the single-blind were biased.
6. Subjects who did not improve during the first part of the trial probably concluded
that they were on the placebo (whether they were or they weren’t) and would
be switched to the “real” medication during the second part of the trial. This
expectation made them improve—the placebo effect.
,Answers to Review Exercises 45
7. (a) This is an observational study, so confounding may be a problem.
(b) Rates of cervical cancer go up with age. Women of different marital status
have different patterns of sexual activity, and are therefore exposed to dif-
ferent kinds of risk; similarly for education. In other words, age, marital
status, and education are potential confounders.
(c) Pill users are more active sexually than non-users, and have more partners.
That seems to be what makes the rate of cervical cancer higher among pill
users. (This is like example 2 on p. 16 or exercise 11 on p. 23.)
(d) No; see (c).
8. Memorial Day is at the end of May; Labor Day is early in September. Just over
25% of the days of the year fall in between. Even if burglars work the same
amount every day, over 25% of the burglaries would occur between Memorial
Day and Labor Day.
9. (a) False. (b) True. (c) False: that is the whole point of experiments.
Discussion. People who eat lots of fruits and vegetables are different from the
rest of us in many other ways. Some other aspect of diet or life style may be
protective. Of course, the observational studies might be right; something in
the fruits and vegetables other than the vitamins might be the protective factor.
10. (a) Observational study. (b) Yes. (c) Yes.
(d) No. The gene would also have to be associated with controlling behavior
by the mother (p.20).
(e) A mother who sees her child eat too much might respond in a way that
psychologists would interpret as “controlling”—Johnny, stop eating!
(f) No. The Chronicle seems to have over-reacted.
11. (a) The treatment group consists of those who finished boot camp. The control
group consists of other prisoners—including those who do not volunteer,
or those who volunteer but do not complete the program.
(b) This is observational. The prisoners decide whether to volunteer for boot
camp and whether to stay in the program or drop out. That is the problem:
those who volunteer and stay the course might be quite different from who
volunteer but drop out.
(c) False.
Comment. An experiment could be done either like the polio trial (p. 1ff) or the
HIP trial (exercise 9 on pp.22–23):
Like the polio trial. Ask for volunteers. Randomize some of the volunteers
to treatment (assignment to boot camp) and some to control. Compare
the recidivism rate for the two groups—but include the dropouts in the
treatment group. (Otherwise, you still have the problem of self-selection.)
,46 Chapter 2
Like the HIP trial. Take a group of prisoners. Randomize some to treatment
(invitation to participate in boot camp) and some to control. Compare the
recidivism rate for the two groups—but include in the treatment group those
who decline to participate and those who drop out. (Again, this is to guard
against the problem of self-selection.)
12. False. The conclusion does not follow. This is just like the admissions study
(pp. 17ff). The Democrats may be concentrated in wards with low turnouts.
Here is an example, with only two wards (and see exercise 13 on p. 24).
DEMOCRATS REPUBLICANS
Total number Number voting Total number Number voting
Ward A 1000 100 100 5
Ward B 100 60 1000 500
Part II. Descriptive Statistics
Chapter 3. The Histogram
1. 66 inches, 72 inches.
2. (a) There are more at age 1. The histogram is higher at 1 than at 71.
(b) There are more at age 21.
(c) There are more age 0–4,
(d) 50%
Histogram for review exercise 2, chapter 3
2
1
0
0 10 20 30 40 50 60 70 80
AGE (YEARS)
3. (a) Rounding.
(b) No. Taking percentages adjusts for the difference between the total num-
bers. On the whole, rental units tend to be smaller.
(c) Rental units are smaller, as noted above.
, Answers to Review Exercises 47
Histograms for review exercise 3, chapter 3
(The histogram for owners is shifted to the right)
Rent
40 Own
30
20
10
0
0 1 2 3 4 5 6 7 8 9 10 11 12
NUMBER OF ROOMS
4. (a) 25% (b) 99% (c) 140–150 mm (d) 135–140 mm
(e) About 5 × 2.1 = 10.5% (f) 102–103 mm
(g) 117–118 mm is a good guess; the interval is somewhere between 115 and
120 mm.
5. $10 thousand × 1% per thousand dollars = 10%.
6. (i) and (ii) not (iii).
Reason: With lists (i) and (ii), 25% of the people have heights between 66.5
inches and 67.5 inches; 50% between 67.5 and 68.5 inches; 25% between 68.5
and 69.5 inches. Not so with list (iii).
7. (i) Natural causes. (ii) Trauma.
Reason: Young people die of accidents, murder, etc. Old people die of heart
disease, cancer, etc.
8. (a) is true, (b) and (c) are false. The figure does not adjust for the different
lengths of the class intervals, and is misleading for that reason.
9. (a) True. (b) True.
(c) People with failing GPAs may round them up; and 2 is such an important
number—for GPAs—that people with GPAs just above 2 may round them
down.
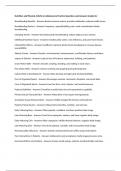
10. (a) The histogram is shown below.
20 1880
1970
10
0
0 1 2 3 4 5 6 7 8 9
DIGIT