Making Business Decisions:
The Kentucky Milk Case
(To accompany Chapters 1 and 2)
There are many things that could be included in a report about the possibility of collusion. I have concentrated on
the incumbency rates, bid levels and dispersion, and average winning bids. With the data available, no comparison
of market share can be made since there was so much missing data. Actually, with the data available, the exact
analysis cannot be made, since only the winning bid information is provided. Thus, we have no idea what the losing
bids were. I will present what I think is a reasonable solution. This is by no means the only solution to the case.
Many other presentations could also be used.
Incumbency Rates
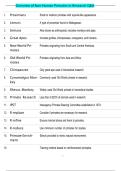
The incumbency rate is the percent of the school districts that are won by the same vendor who won the previous
year. A table containing the incumbency rates is included as well as a plot. Notice in the plot that the incumbency
rates in the Tri-county market is higher than that in the Surrounding market. From 1985 through 1988, the
incumbency rate for the Tri-county market was never lower than .923, while in the same period in the Surrounding
market, the incumbency rate was never higher than .730. This implies the possibility of collusion in the Tri-county
market.
Surrounding Market Tri-county Market
Year Number of Same Incumbency Number of Same Incumbency
Districts Vendors Rate Districts Vendors Rate
1984 26 16 .615 10 8 .800
1985 27 19 .704 12 12 1.000
1986 32 19 .594 13 13 1.000
1987 37 27 .730 13 12 .923
1988 37 25 .676 13 13 1.000
1989 37 23 .622 13 9 .692
1990 34 24 .706 13 10 .769
1991 5 3 .600 13 11 .846
90
Copyright © 2011 Pearson Education, Inc. Publishing as Prentice Hall.
,Making Business Decisions: The Kentucky Milk Case 91
The plot of the incumbency rates is:
Bid Levels and Dispersion
Since we only have access to the winning bids in each of the school districts, we cannot make a true analysis of the
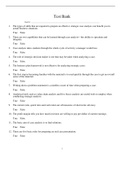
bid levels and dispersions. As a compromise, I have used the winning bids of the two dairies in question—Trauth
and Meyer. I have looked at only the winning bids of these two dairies in both the Tri-county market and in the
Surrounding market. If there was no collusion, then the winning bids and the dispersions of the winning bids should
be similar in the two markets for the two dairies. I looked at the box plots of the winning bids of the two dairies in
each market for each type of milk: whole white, lowfat white and lowfat chocolate. I have included only a few of
the box plots as illustrations. Those included are for 1985 and 1986.
Copyright © 2011 Pearson Education, Inc. Publishing as Prentice Hall.
,92 Making Business Decisions: The Kentucky Milk Case
1985 Winning Bids:
WHOLE LOWFAT LOWFAT
OBS MARKET WINNER WHITE WHITE CHOCOLATE
1 SUR MEYER 0.1280 0.1250 0.1315
2 SUR TRAUTH 0.1200 0.1110 0.1090
3 SUR TRAUTH . 0.1079 0.1079
4 SUR TRAUTH . 0.1190 0.1210
5 SUR MEYER 0.1225 0.1130 0.1099
6 SUR TRAUTH 0.1230 0.1130 0.1120
7 SUR MEYER 0.1250 0.1145 0.1140
8 TRI TRAUTH 0.1440 0.1440 .
9 TRI TRAUTH 0.1450 0.1350 .
10 TRI MEYER 0.1410 0.1410 0.1410
11 TRI TRAUTH 0.1393 0.1393 .
12 TRI MEYER 0.1340 0.1340 0.1340
13 TRI MEYER 0.1445 0.1345 0.1395
14 TRI MEYER . 0.1345 .
15 TRI TRAUTH 0.1449 0.1349 0.1399
16 TRI TRAUTH . 0.1299 0.1299
17 TRI MEYER 0.1480 0.1480 0.1480
18 TRI TRAUTH 0.1310 0.1290 .
19 TRI MEYER . 0.1380 .
20 TRI TRAUTH 0.1435 0.1335 .
Box Plots for Whole White Milk—1985
Boxplots for Whole White Milk - 1985
0.150
0.145
0.140
WWBID
0.135
0.130
0.125
0.120
S U RRO U N D TRI-C O U NTY
M A RKET
Copyright © 2011 Pearson Education, Inc. Publishing as Prentice Hall.
, Making Business Decisions: The Kentucky Milk Case 93
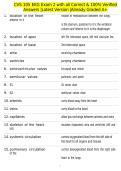
Box Plots for Lowfat White Milk—1985
Boxplots for Lowfat White Milk - 1985
0.15
0.14
L FWBID
0.13
0.12
0.11
S U RRO U N D TRI-C O U N TY
M A RKET
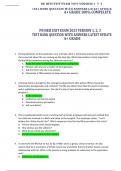
Box Plots for Lowfat Chocolate Milk—1985
Boxplots for Lowfat Chocolate Milk - 1985
0.15
0.14
LFCBID
0.13
0.12
0.11
S U RRO U N D TRI-C O U N TY
M A RKET
Copyright © 2011 Pearson Education, Inc. Publishing as Prentice Hall.
The Kentucky Milk Case
(To accompany Chapters 1 and 2)
There are many things that could be included in a report about the possibility of collusion. I have concentrated on
the incumbency rates, bid levels and dispersion, and average winning bids. With the data available, no comparison
of market share can be made since there was so much missing data. Actually, with the data available, the exact
analysis cannot be made, since only the winning bid information is provided. Thus, we have no idea what the losing
bids were. I will present what I think is a reasonable solution. This is by no means the only solution to the case.
Many other presentations could also be used.
Incumbency Rates
The incumbency rate is the percent of the school districts that are won by the same vendor who won the previous
year. A table containing the incumbency rates is included as well as a plot. Notice in the plot that the incumbency
rates in the Tri-county market is higher than that in the Surrounding market. From 1985 through 1988, the
incumbency rate for the Tri-county market was never lower than .923, while in the same period in the Surrounding
market, the incumbency rate was never higher than .730. This implies the possibility of collusion in the Tri-county
market.
Surrounding Market Tri-county Market
Year Number of Same Incumbency Number of Same Incumbency
Districts Vendors Rate Districts Vendors Rate
1984 26 16 .615 10 8 .800
1985 27 19 .704 12 12 1.000
1986 32 19 .594 13 13 1.000
1987 37 27 .730 13 12 .923
1988 37 25 .676 13 13 1.000
1989 37 23 .622 13 9 .692
1990 34 24 .706 13 10 .769
1991 5 3 .600 13 11 .846
90
Copyright © 2011 Pearson Education, Inc. Publishing as Prentice Hall.
,Making Business Decisions: The Kentucky Milk Case 91
The plot of the incumbency rates is:
Bid Levels and Dispersion
Since we only have access to the winning bids in each of the school districts, we cannot make a true analysis of the
bid levels and dispersions. As a compromise, I have used the winning bids of the two dairies in question—Trauth
and Meyer. I have looked at only the winning bids of these two dairies in both the Tri-county market and in the
Surrounding market. If there was no collusion, then the winning bids and the dispersions of the winning bids should
be similar in the two markets for the two dairies. I looked at the box plots of the winning bids of the two dairies in
each market for each type of milk: whole white, lowfat white and lowfat chocolate. I have included only a few of
the box plots as illustrations. Those included are for 1985 and 1986.
Copyright © 2011 Pearson Education, Inc. Publishing as Prentice Hall.
,92 Making Business Decisions: The Kentucky Milk Case
1985 Winning Bids:
WHOLE LOWFAT LOWFAT
OBS MARKET WINNER WHITE WHITE CHOCOLATE
1 SUR MEYER 0.1280 0.1250 0.1315
2 SUR TRAUTH 0.1200 0.1110 0.1090
3 SUR TRAUTH . 0.1079 0.1079
4 SUR TRAUTH . 0.1190 0.1210
5 SUR MEYER 0.1225 0.1130 0.1099
6 SUR TRAUTH 0.1230 0.1130 0.1120
7 SUR MEYER 0.1250 0.1145 0.1140
8 TRI TRAUTH 0.1440 0.1440 .
9 TRI TRAUTH 0.1450 0.1350 .
10 TRI MEYER 0.1410 0.1410 0.1410
11 TRI TRAUTH 0.1393 0.1393 .
12 TRI MEYER 0.1340 0.1340 0.1340
13 TRI MEYER 0.1445 0.1345 0.1395
14 TRI MEYER . 0.1345 .
15 TRI TRAUTH 0.1449 0.1349 0.1399
16 TRI TRAUTH . 0.1299 0.1299
17 TRI MEYER 0.1480 0.1480 0.1480
18 TRI TRAUTH 0.1310 0.1290 .
19 TRI MEYER . 0.1380 .
20 TRI TRAUTH 0.1435 0.1335 .
Box Plots for Whole White Milk—1985
Boxplots for Whole White Milk - 1985
0.150
0.145
0.140
WWBID
0.135
0.130
0.125
0.120
S U RRO U N D TRI-C O U NTY
M A RKET
Copyright © 2011 Pearson Education, Inc. Publishing as Prentice Hall.
, Making Business Decisions: The Kentucky Milk Case 93
Box Plots for Lowfat White Milk—1985
Boxplots for Lowfat White Milk - 1985
0.15
0.14
L FWBID
0.13
0.12
0.11
S U RRO U N D TRI-C O U N TY
M A RKET
Box Plots for Lowfat Chocolate Milk—1985
Boxplots for Lowfat Chocolate Milk - 1985
0.15
0.14
LFCBID
0.13
0.12
0.11
S U RRO U N D TRI-C O U N TY
M A RKET
Copyright © 2011 Pearson Education, Inc. Publishing as Prentice Hall.