Calorimetry - BTEC Applied Science Unit 2
Learning Aim B | Updated 2022
Checklist
Calibration of thermometers
- Table of results, with appropriate headings, units and averages
- Statement of which thermometer was best overall (both @ 0 °C and 100 °C)
- Explanation of which thermometer you are using and why you have chosen it
- Explanation of why you did not pick the other two thermometers
Cooling curve for stearic acid
- Full method
- Table of results, with appropriate headings and units
- Graph of time vs temperature, with all points plotted and a line of best fit
- Rate of cooling calculated at the beginning, middle and end of the graph.
- Comment on rate of cooling – why are some rates higher than others?
- Melting point defined and explained in terms of intermolecular forces
- Melting point marked on the graph
- Melting point researched online – comparison of your melting point to the online one. Is it
different? Why is it different? Calculate a percentage difference.
- Melting point compared to a classmate’s. Is it different? Why is it different? Calculate a
percentage difference.
Same as above for cooling curve for paraffin wax
Overall conclusion
- What could be improved?
- How could it be improved?
- How could you reduce uncertainty?
Calculating Rates and Differences
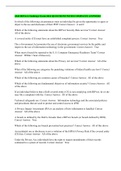
1. For the following graphs, calculate:
a) The rate of cooling between 0 and 2 mins.
b) The rate of cooling between 14 and 16 mins.
c) State the melting point of each.
2. For the first graph only, calculate the % difference if the actual melting
point is 75 °C.
3. For the second graph only, calculate the % difference if the actual
melting point is 140 °C.
,
Learning Aim B | Updated 2022
Checklist
Calibration of thermometers
- Table of results, with appropriate headings, units and averages
- Statement of which thermometer was best overall (both @ 0 °C and 100 °C)
- Explanation of which thermometer you are using and why you have chosen it
- Explanation of why you did not pick the other two thermometers
Cooling curve for stearic acid
- Full method
- Table of results, with appropriate headings and units
- Graph of time vs temperature, with all points plotted and a line of best fit
- Rate of cooling calculated at the beginning, middle and end of the graph.
- Comment on rate of cooling – why are some rates higher than others?
- Melting point defined and explained in terms of intermolecular forces
- Melting point marked on the graph
- Melting point researched online – comparison of your melting point to the online one. Is it
different? Why is it different? Calculate a percentage difference.
- Melting point compared to a classmate’s. Is it different? Why is it different? Calculate a
percentage difference.
Same as above for cooling curve for paraffin wax
Overall conclusion
- What could be improved?
- How could it be improved?
- How could you reduce uncertainty?
Calculating Rates and Differences
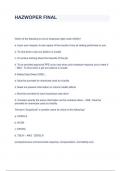
1. For the following graphs, calculate:
a) The rate of cooling between 0 and 2 mins.
b) The rate of cooling between 14 and 16 mins.
c) State the melting point of each.
2. For the first graph only, calculate the % difference if the actual melting
point is 75 °C.
3. For the second graph only, calculate the % difference if the actual
melting point is 140 °C.
,