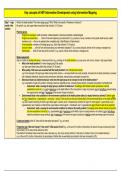
Summary International Business Environment
Demand: how much of a product consumers are willing to purchase.
Key determinant = price. Demand for a good is falling in its price.
➢ Price elasticity of demand = how strongly demand reacts to a price change
(percentage of change in demand due to 1% change in price).
Low elasticity → steep demand curve
High elasticity → flat demand curve
➢ Price elasticity of supply = how strongly supply reacts to a price change (percentage
of change in supply due to 1% change in price).
Low elasticity → steep supply curve
High elasticity → flat supply curve
Product price is the key determinant of how much firms are willing to produce and sell: supply
an extra unit as long as the marginal revenue from selling this unit exceeds the marginal cost.
The supply of a good increases in its price.
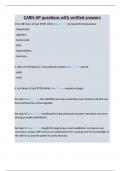
Consumer surplus
Area a + b = total willingness to pay
Area b = consumers’ expenditures
Area a = consumer surplus
Producer surplus
Area c = total cost of production
Area c + d = firm’s revenue
Area d = producer surplus
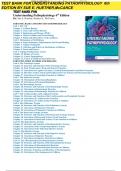
,National market without trade (autarky)
If demand is bigger than supply (excess demand), the price increases. If supply is bigger than
demand (excess supply), the price falls.
Prices will be stable and the market in equilibrium when supply equals demand.
P* = equilibrium price
Q* = equilibrium quantity
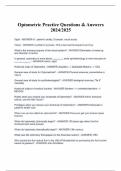
National market with trade
Domestic producers are now facing foreign competition. If the international price is below the
domestic autarky price, the domestic producers will eventually lower their prices and production.
At Pw domestic demand exceeds domestic supply.
The excess demand in the domestic market is imported (Qs
to Qd).
Opening to free trade
will increase the
consumer surplus and
decrease the producer
surplus.
, Total welfare will increase → trade triangle = area c,
gain from trade.
Net welfare gain (trade triangle):
● Consumption effect = welfare gain due to increase
in quantity consumed.
● Production effect = welfare gain due to shifting to
cheaper foreign producers.
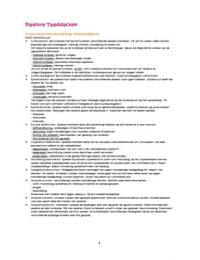
Rest of the world (exporting countries)
At Pw domestic supply exceeds domestic
demand.
The excess supply in the domestic market is
exported.
Consumers lose wellbeing (area D),
producers gain wellbeing (area D+E). Net
gain = area E (trade triangle) → free trade
has a positive effect on the overall
wellbeing (size of the trade triangle).
Determining the world price
➢ If there are no transportation costs or other trade frictions, free trade will result in both
countries having the same price (Pw).
➢ A higher price lowers the excess demand (imports) in the country and increases the
excess supply (exports) in the rest of the world. If demand exceeds supply, the price
increases. If demand is lower than supply, the price falls.
➢ The global market is in equilibrium when the demand for imports equals the supply of
exports.
, The demand for imports (MD) curve shows the excess of domestic demand over domestic
supply:
MD = 0 if P = P* MD > 0 if P < P*
The supply of exports (XS) curve shows the excess of domestic supply over domestic
demand.
XS = 0 if P = P* XS > 0 if P > P*
Global market equilibrium: MD = XS
Aggregate effects
● Trade makes every country better off.
● The larger the price change from trade (difference between world price and autarky
price), the bigger the welfare gain. The country experiencing the larger price change
gains more from the trade.
● In a country with a steep (low price elasticity) import demand or export supply curve the
price change is bigger and the welfare gain from trade is larger.
● An increase in the world price of a product benefits exporting countries and hurts
importing countries.
Demand for imports (MD): quantity that the country wants to import for each possible
international price. Given by the excess of domestic demand over domestic supply at these
prices.
Supply of exports (XS): quantity that the country wants to export for each possible
international price. Given by the excess of domestic supply over domestic demand at these
prices.
Demand: how much of a product consumers are willing to purchase.
Key determinant = price. Demand for a good is falling in its price.
➢ Price elasticity of demand = how strongly demand reacts to a price change
(percentage of change in demand due to 1% change in price).
Low elasticity → steep demand curve
High elasticity → flat demand curve
➢ Price elasticity of supply = how strongly supply reacts to a price change (percentage
of change in supply due to 1% change in price).
Low elasticity → steep supply curve
High elasticity → flat supply curve
Product price is the key determinant of how much firms are willing to produce and sell: supply
an extra unit as long as the marginal revenue from selling this unit exceeds the marginal cost.
The supply of a good increases in its price.
Consumer surplus
Area a + b = total willingness to pay
Area b = consumers’ expenditures
Area a = consumer surplus
Producer surplus
Area c = total cost of production
Area c + d = firm’s revenue
Area d = producer surplus
,National market without trade (autarky)
If demand is bigger than supply (excess demand), the price increases. If supply is bigger than
demand (excess supply), the price falls.
Prices will be stable and the market in equilibrium when supply equals demand.
P* = equilibrium price
Q* = equilibrium quantity
National market with trade
Domestic producers are now facing foreign competition. If the international price is below the
domestic autarky price, the domestic producers will eventually lower their prices and production.
At Pw domestic demand exceeds domestic supply.
The excess demand in the domestic market is imported (Qs
to Qd).
Opening to free trade
will increase the
consumer surplus and
decrease the producer
surplus.
, Total welfare will increase → trade triangle = area c,
gain from trade.
Net welfare gain (trade triangle):
● Consumption effect = welfare gain due to increase
in quantity consumed.
● Production effect = welfare gain due to shifting to
cheaper foreign producers.
Rest of the world (exporting countries)
At Pw domestic supply exceeds domestic
demand.
The excess supply in the domestic market is
exported.
Consumers lose wellbeing (area D),
producers gain wellbeing (area D+E). Net
gain = area E (trade triangle) → free trade
has a positive effect on the overall
wellbeing (size of the trade triangle).
Determining the world price
➢ If there are no transportation costs or other trade frictions, free trade will result in both
countries having the same price (Pw).
➢ A higher price lowers the excess demand (imports) in the country and increases the
excess supply (exports) in the rest of the world. If demand exceeds supply, the price
increases. If demand is lower than supply, the price falls.
➢ The global market is in equilibrium when the demand for imports equals the supply of
exports.
, The demand for imports (MD) curve shows the excess of domestic demand over domestic
supply:
MD = 0 if P = P* MD > 0 if P < P*
The supply of exports (XS) curve shows the excess of domestic supply over domestic
demand.
XS = 0 if P = P* XS > 0 if P > P*
Global market equilibrium: MD = XS
Aggregate effects
● Trade makes every country better off.
● The larger the price change from trade (difference between world price and autarky
price), the bigger the welfare gain. The country experiencing the larger price change
gains more from the trade.
● In a country with a steep (low price elasticity) import demand or export supply curve the
price change is bigger and the welfare gain from trade is larger.
● An increase in the world price of a product benefits exporting countries and hurts
importing countries.
Demand for imports (MD): quantity that the country wants to import for each possible
international price. Given by the excess of domestic demand over domestic supply at these
prices.
Supply of exports (XS): quantity that the country wants to export for each possible
international price. Given by the excess of domestic supply over domestic demand at these
prices.