Chapter 8
Government intervention to reduce inequality
and poverty
8.1 Inequality and poverty in SADC countries
Measures to quality inequality and poverty
1. Poverty rates - % of the population living below the “poverty line” – US$3.20
per person per day (International poverty line determined by the World bank in
2018)
2. Gini coefficient - measures of income distribution – deviation of actual income
distribution a country from the line of absolute equality
a. 0 > GC < 1 – closer to 1 = more unequal income distribution
b. 0 = perfect equality – Lorenz curve is the same as the actual
distribution
c. 1 = perfect inequality – all income goes to one member of the
population
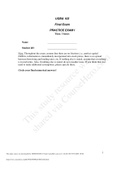
Table Analysis:
o Poverty is spread across all SADC countries (except Seychelles and
Mauritius)
o In Mozambique – population is equally poor – moderate GC
GB – DO NOT DISTRIBUTE
, o In SA – income spread is more significant – high GC
o Poverty rate (37.6%) is high for a middle-income country in comparison
to other middle-income countries (Brazil 8.0%, Colombia 11.8% and
Indonesia 30.9%)
o Gini coefficient income shares per income quintile for SA:
o Quintile 1 (lowest) = 2.4%
o Quintile 2 = 4.8%
o Quintile 3 = 8.2%
o Quintile 4 = 16.5%
o Quintile 5 (highest) = 68.2%
o NOTE! Lowest 40% of the population only earn 7.2% of SA’s total
income
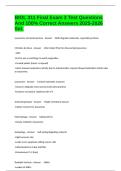
o GC is derived from the Lorenz curve – shows cumulative income shares of
cumulative fractions of the population
o GC is the measure of the extent to which actual income distribution
deviates from the Lorenz curve.
o Calculation method using the graph: area A/ (area A + area B)
8.2 Budget, redistribution and poverty alleviation
Fiscal policy tools used to reduce poverty and inequality:
Include taxes, government expenditure programmes and regulation.
Short term → national budget an important instrument to influence distribution
of private earnings.
Long term → (indirect effects of fiscal system) → government spending and
taxes influence economic growth rates, investment in physical and human
capital (major determinants of distribution of earnings from capital and labour
activity)
GB – DO NOT DISTRIBUTE
Government intervention to reduce inequality
and poverty
8.1 Inequality and poverty in SADC countries
Measures to quality inequality and poverty
1. Poverty rates - % of the population living below the “poverty line” – US$3.20
per person per day (International poverty line determined by the World bank in
2018)
2. Gini coefficient - measures of income distribution – deviation of actual income
distribution a country from the line of absolute equality
a. 0 > GC < 1 – closer to 1 = more unequal income distribution
b. 0 = perfect equality – Lorenz curve is the same as the actual
distribution
c. 1 = perfect inequality – all income goes to one member of the
population
Table Analysis:
o Poverty is spread across all SADC countries (except Seychelles and
Mauritius)
o In Mozambique – population is equally poor – moderate GC
GB – DO NOT DISTRIBUTE
, o In SA – income spread is more significant – high GC
o Poverty rate (37.6%) is high for a middle-income country in comparison
to other middle-income countries (Brazil 8.0%, Colombia 11.8% and
Indonesia 30.9%)
o Gini coefficient income shares per income quintile for SA:
o Quintile 1 (lowest) = 2.4%
o Quintile 2 = 4.8%
o Quintile 3 = 8.2%
o Quintile 4 = 16.5%
o Quintile 5 (highest) = 68.2%
o NOTE! Lowest 40% of the population only earn 7.2% of SA’s total
income
o GC is derived from the Lorenz curve – shows cumulative income shares of
cumulative fractions of the population
o GC is the measure of the extent to which actual income distribution
deviates from the Lorenz curve.
o Calculation method using the graph: area A/ (area A + area B)
8.2 Budget, redistribution and poverty alleviation
Fiscal policy tools used to reduce poverty and inequality:
Include taxes, government expenditure programmes and regulation.
Short term → national budget an important instrument to influence distribution
of private earnings.
Long term → (indirect effects of fiscal system) → government spending and
taxes influence economic growth rates, investment in physical and human
capital (major determinants of distribution of earnings from capital and labour
activity)
GB – DO NOT DISTRIBUTE