SPSS HANDLEIDING
! afronden op 2 decimalen: bv 26.81 (2 na komma)
notitie met p enz: t(455 <df>) = -1.610 <t>, p = .108.
Practical 1 - Assignment 1: Introduction to SPSS
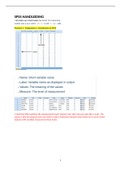
I: Note that SPSS combines the measurement levels 'interval' and 'ratio' into one and calls it 'scale'. The
reason is that the program does not need to make a distinction between those levels for it can do similar
analyses with variables measured on these levels.
1
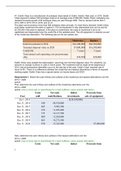
,Practical 1 - Assignment 2: Descriptive Statistics
FREQUENTIETABELLEN
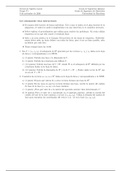
I: A frequency table shows the frequency distribution of the chosen variables. In other words, it shows
how often each value of a variable occurs in the sample.
2
, kijken naar de output table, beginnend met ‘statistics’ table
3
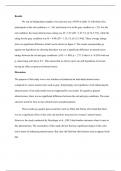
, HISTOGRAM
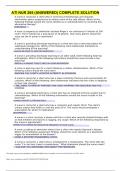
I: A histogram is another way to display the frequencies of a variable. It allows us to easily see if the
data on a variable are normally distributed.
It is important to keep in mind, however, that histograms are mostly useful when variables are
measured on a continuous scale.
Mean en SD rechtsboven in de hoek
4
! afronden op 2 decimalen: bv 26.81 (2 na komma)
notitie met p enz: t(455 <df>) = -1.610 <t>, p = .108.
Practical 1 - Assignment 1: Introduction to SPSS
I: Note that SPSS combines the measurement levels 'interval' and 'ratio' into one and calls it 'scale'. The
reason is that the program does not need to make a distinction between those levels for it can do similar
analyses with variables measured on these levels.
1
,Practical 1 - Assignment 2: Descriptive Statistics
FREQUENTIETABELLEN
I: A frequency table shows the frequency distribution of the chosen variables. In other words, it shows
how often each value of a variable occurs in the sample.
2
, kijken naar de output table, beginnend met ‘statistics’ table
3
, HISTOGRAM
I: A histogram is another way to display the frequencies of a variable. It allows us to easily see if the
data on a variable are normally distributed.
It is important to keep in mind, however, that histograms are mostly useful when variables are
measured on a continuous scale.
Mean en SD rechtsboven in de hoek
4