Lecture 1:
Why study experiments:
1. Best way to get causal knowledge:
a. Econometric/modelling techniques can always try to control for variables and get as
close as possible to causality. But in the end only true randomization can really do
this most convincingly.
b. Gordon et al. find that various (correlational) methods of trying to get causal effects
of advertising effectiveness are inaccurate.
c. A true experiment is needed to get accurate data of your advertisement.
- True randomization is the best way to get causal knowledge:
o More and more companies seem to realize that
o This helps them learn, grow, and prevent mistakes
- (and because many of you will use an experiment for your thesis)
So, why study experiments?
Thomke & Manzi (2014), part of the literature
Also show that with larger business decisions, experiments can really help.
Should you open your stores an hour later?
You can calculate the costs of that hour and compare this to the sales in that hour.
But would those people in the early hour not just have appeared in the store later anyway if it would
have been closed that hour?
Kohavi & Thomke (2017):
Most business progress happens by small improvements, not some huge disruptions:
So, why study experiments:
- Big data is past behavior, you make an inference on what you think happened
- But if you change something, do you hit the right spot? Will it change something?
o An experiment does exactly this. It is forward looking, not backward looking.
- And if you change something you can often think of 10 different new ways to do so, but
eventually have to pick one. Every idea is uncertain, so how do you know which is best?
o An experiment can test which idea is best as well
Why do we do research?
Different research types:
,Descriptive research: Describes behavior, thoughts or feelings
- Public opinion poll/ survey
- Example: site visitors indicate that the shipping costs were too high
- For males this was 30% for females this is 50%
- Changes can be measured if respondents fill out the survey at different points in time.
Causality:
- Whether one thing causes the other
- Will our sales increase if we launch this new product?
- Do we sell more when it is warm or cold outside?
- Etc.
- Most naïve solution is regression (correlation)
Correlation research:
- Investigates how relationships among variables
- Aim to discover correlations between variables
- Used to describe relationship between two or more naturally occurring variables.
- Can run correlation between temperature and mood. Pick temperatures today in diff. places
in Europe and measure the mood of people in those places, possible in the case, because
theoretically temperature must be the IV. But, might be other factors that we did not yet
measure. Humidity and temperature are related and maybe humidity is what drives the
effect. Slightly less naïve method → multiple regression. We miss still many likely other
factors that might play a role.
- Correlations cannot establish causality
Causality:
Three requirements:
- Correlation
- Directionality (logical in time) first X then Y
- Elimination of extraneous variables
Descriptive or correlational:
- Descriptive data:
- 40% of visitors (site) who do not convert to customers, indicate that shipping costs are too
high.
- But if correlational data is the relation between two variables, is the gender → free shipping
preference not a correlational datapoint (instead of descriptive one?)
Correlations are descriptive of data.
Experimental research:
- Aim to find whether certain variables causes changes in behavior, thought or emotions.
- Involves manipulating IV and assessing changes in DV.
- Key = randomization of subjects to treatment
- If DV changes we can infer that X causes Y.
Randomization:
- Arbitrarily assigning each participant to one condition of the experiment
- If I assign person A to control group & person B to treatment group, they are not the same.
- However, if I do this for every subject, the average person in the control group = the average
person in the treatment group
- With large samples, true randomization creates balance for variables for example like: age,
gender, preferences. Thus groups are on average the same.
, - Any differences we find must be occurred because of the treatment.
With randomization it is better than for example matching techniques that economists marketing
modelers tend to use → because matching we have to a priori predict possible confounds
(alternative explanations), and match people based on those confounds. However, we might not
know all confounds.
Quasi-experiment: when manipulating IV is not possible → quasi-experiment
Doing experiments consists of three phases:
1. Formulation hypothesis and problem statement.
2. Design experiment: manipulate IV observe effect of DV. And control for confounding.
3. Data analysis and interpretation of findings: using ANOVA for example.
Good theory:
- What: defines constructs
- How: Propositions about the relationship
- Why: arguments that justify the propositions
Defining constructs:
Conceptual definition: definition based on literature
Operational definition: how to measure the conceptual definition.
Stat video: basics of why we test:
Example: does taking pictures with the goal to share them with others reduce enjoyment of the
moment?
N = 227
IV: instructed to make some picture for self (for a later memory) or for others (to share).
DV: How much did you enjoy your Christmas photo-taking experience (1 not at all – 7 extremely)
Means seem to differ, but we have to test this to be sure there is an actual difference. Use statistics
to estimate the effect, whether it is truly there. When the difference is not statistically significant,
there is no real effect.
What is a p-value?
It is not the chance that our hypothesis is true.
It is not the chance that the null-hypothesis is false (there is no difference).
P-value = the chance that you find your data (or a more extreme form), if you assume the null-
hypothesis is true. If you assume that there is no effect, how likely is it that you find this data.
If there is no effect, this data is quite unlikely.
, Some tips on reporting P-values:
Do not round p-values to p < 0.05 or p< 0.01 or even P> 0.05 just report it as it is; p = 0.12 or p =
0.118
Unless P value is very small.
P-values a bit larger than 0.05 (marginally significant for example 0.071)?
- Doesn’t mean there is a small effect.
- Only means the change that you find this data when there is no effect.
- It does not mean that if you had more participants, it would have been significant.
- It simply means that data is bit less surprising if you assume the null-hypothesis is true.
Standard deviation:
How much variance there is within every group:
Example calculation SD:
SD = something like the average deviation from the mean.
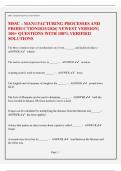
Normal distribution:
68% will be within -1 or +1 SD of the mean, most of the respondents will be around the average.
95% of the values are within 2 SD of the mean.
99,7% of values are within 3 SD of the mean.
Why study experiments:
1. Best way to get causal knowledge:
a. Econometric/modelling techniques can always try to control for variables and get as
close as possible to causality. But in the end only true randomization can really do
this most convincingly.
b. Gordon et al. find that various (correlational) methods of trying to get causal effects
of advertising effectiveness are inaccurate.
c. A true experiment is needed to get accurate data of your advertisement.
- True randomization is the best way to get causal knowledge:
o More and more companies seem to realize that
o This helps them learn, grow, and prevent mistakes
- (and because many of you will use an experiment for your thesis)
So, why study experiments?
Thomke & Manzi (2014), part of the literature
Also show that with larger business decisions, experiments can really help.
Should you open your stores an hour later?
You can calculate the costs of that hour and compare this to the sales in that hour.
But would those people in the early hour not just have appeared in the store later anyway if it would
have been closed that hour?
Kohavi & Thomke (2017):
Most business progress happens by small improvements, not some huge disruptions:
So, why study experiments:
- Big data is past behavior, you make an inference on what you think happened
- But if you change something, do you hit the right spot? Will it change something?
o An experiment does exactly this. It is forward looking, not backward looking.
- And if you change something you can often think of 10 different new ways to do so, but
eventually have to pick one. Every idea is uncertain, so how do you know which is best?
o An experiment can test which idea is best as well
Why do we do research?
Different research types:
,Descriptive research: Describes behavior, thoughts or feelings
- Public opinion poll/ survey
- Example: site visitors indicate that the shipping costs were too high
- For males this was 30% for females this is 50%
- Changes can be measured if respondents fill out the survey at different points in time.
Causality:
- Whether one thing causes the other
- Will our sales increase if we launch this new product?
- Do we sell more when it is warm or cold outside?
- Etc.
- Most naïve solution is regression (correlation)
Correlation research:
- Investigates how relationships among variables
- Aim to discover correlations between variables
- Used to describe relationship between two or more naturally occurring variables.
- Can run correlation between temperature and mood. Pick temperatures today in diff. places
in Europe and measure the mood of people in those places, possible in the case, because
theoretically temperature must be the IV. But, might be other factors that we did not yet
measure. Humidity and temperature are related and maybe humidity is what drives the
effect. Slightly less naïve method → multiple regression. We miss still many likely other
factors that might play a role.
- Correlations cannot establish causality
Causality:
Three requirements:
- Correlation
- Directionality (logical in time) first X then Y
- Elimination of extraneous variables
Descriptive or correlational:
- Descriptive data:
- 40% of visitors (site) who do not convert to customers, indicate that shipping costs are too
high.
- But if correlational data is the relation between two variables, is the gender → free shipping
preference not a correlational datapoint (instead of descriptive one?)
Correlations are descriptive of data.
Experimental research:
- Aim to find whether certain variables causes changes in behavior, thought or emotions.
- Involves manipulating IV and assessing changes in DV.
- Key = randomization of subjects to treatment
- If DV changes we can infer that X causes Y.
Randomization:
- Arbitrarily assigning each participant to one condition of the experiment
- If I assign person A to control group & person B to treatment group, they are not the same.
- However, if I do this for every subject, the average person in the control group = the average
person in the treatment group
- With large samples, true randomization creates balance for variables for example like: age,
gender, preferences. Thus groups are on average the same.
, - Any differences we find must be occurred because of the treatment.
With randomization it is better than for example matching techniques that economists marketing
modelers tend to use → because matching we have to a priori predict possible confounds
(alternative explanations), and match people based on those confounds. However, we might not
know all confounds.
Quasi-experiment: when manipulating IV is not possible → quasi-experiment
Doing experiments consists of three phases:
1. Formulation hypothesis and problem statement.
2. Design experiment: manipulate IV observe effect of DV. And control for confounding.
3. Data analysis and interpretation of findings: using ANOVA for example.
Good theory:
- What: defines constructs
- How: Propositions about the relationship
- Why: arguments that justify the propositions
Defining constructs:
Conceptual definition: definition based on literature
Operational definition: how to measure the conceptual definition.
Stat video: basics of why we test:
Example: does taking pictures with the goal to share them with others reduce enjoyment of the
moment?
N = 227
IV: instructed to make some picture for self (for a later memory) or for others (to share).
DV: How much did you enjoy your Christmas photo-taking experience (1 not at all – 7 extremely)
Means seem to differ, but we have to test this to be sure there is an actual difference. Use statistics
to estimate the effect, whether it is truly there. When the difference is not statistically significant,
there is no real effect.
What is a p-value?
It is not the chance that our hypothesis is true.
It is not the chance that the null-hypothesis is false (there is no difference).
P-value = the chance that you find your data (or a more extreme form), if you assume the null-
hypothesis is true. If you assume that there is no effect, how likely is it that you find this data.
If there is no effect, this data is quite unlikely.
, Some tips on reporting P-values:
Do not round p-values to p < 0.05 or p< 0.01 or even P> 0.05 just report it as it is; p = 0.12 or p =
0.118
Unless P value is very small.
P-values a bit larger than 0.05 (marginally significant for example 0.071)?
- Doesn’t mean there is a small effect.
- Only means the change that you find this data when there is no effect.
- It does not mean that if you had more participants, it would have been significant.
- It simply means that data is bit less surprising if you assume the null-hypothesis is true.
Standard deviation:
How much variance there is within every group:
Example calculation SD:
SD = something like the average deviation from the mean.
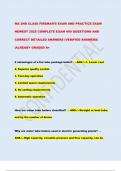
Normal distribution:
68% will be within -1 or +1 SD of the mean, most of the respondents will be around the average.
95% of the values are within 2 SD of the mean.
99,7% of values are within 3 SD of the mean.