Frequentetabel = nominaal, ordinaal en discreet
- Frequentie
- Proportie
- Cumulatieve frequentie
- Cumulatieve proportie
Kerngetallen = continue
- Centrummaten
o Modus
o Mediaan
o Gemiddelde
- Spreidingsmaten
o Bereik
o Standaarddeviatie
o Variantie
o IQR
2 nominale/discrete/ordinale variabelen = kruistabel/contingentietabel
1 discrete/nominale/ordinale variabele en 1 continue variabele = breakdown tabel
2 continue variabelen = correlatie berekenen
- Tussen -1 en 1
o Teken
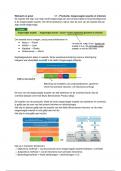
+ = positief verband: hoge waarde van ene variabele geassocieerd met
hogere waarde van andere variabele (lengte en gewicht
- = negatief verband: hoge waarde van ene variabel gelijk met lage waarde
van andere variabele. (T en hoogte zeespiegel)
o Absolute waarde = sterkte van verband
Hoe hoger: hoe meer op 1 lijn = perfecte lijn
Meer afwijken van de lijn = lagere correlatie
- Correlatie = 0: geen verband (binair)
1 discrete/nominale/ordinale variabele = taart, staaf of lijndiagram
1 continue variabele = histogram of boxplot
2 discrete/nominale/ordinale = tart, staaf of lijn
1 continue variabele met 1 dNO = histogram en boxplot
2 continue variabelen = scatterplot
, Betrouwbaarheidsintervallen
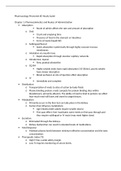
- Inferentiële statistiek = conclusies veraglemenen van sample naar populatie
- Confidence interval = interval van plausibele waarden voor de populatieparameter.
= 95% betrouwbaarheid interval
Parameters van CI van het gemiddelde
- Steekproefgrote
- Variantie van de variabele
- betrouwbaarheid
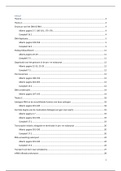
Hypothesetoetsing
1. Formulering nulhypothese (populatie), alternatieve hypothese (zelfde populatieparameter,
over nulhypothese) en significantieniveau (moment dat we nulhypothese verwerpen)
2. Zoek een teststatistiek en zijn verdeling (2 keer alfa/2 aan de kanten van grafiek weg)
3. Berekend de p-waarde voor geobserveerde teststatistiek
Hoe kleiner, hoe kleiner evidentie tegen H0
P < alfa (type 1 fout) = verwerp nulhypothese
4. Conclusie
Ho = gemiddelde nogsteed 14,6
Ha = gemiddelde niet gelijk aan 14,6
Alfa = 5%
S2 = 24,01
(15,9 – 14,6 ): (0,05(hier ook wortel van want wij hebben kwadraat): (wortel:147)
- Frequentie
- Proportie
- Cumulatieve frequentie
- Cumulatieve proportie
Kerngetallen = continue
- Centrummaten
o Modus
o Mediaan
o Gemiddelde
- Spreidingsmaten
o Bereik
o Standaarddeviatie
o Variantie
o IQR
2 nominale/discrete/ordinale variabelen = kruistabel/contingentietabel
1 discrete/nominale/ordinale variabele en 1 continue variabele = breakdown tabel
2 continue variabelen = correlatie berekenen
- Tussen -1 en 1
o Teken
+ = positief verband: hoge waarde van ene variabele geassocieerd met
hogere waarde van andere variabele (lengte en gewicht
- = negatief verband: hoge waarde van ene variabel gelijk met lage waarde
van andere variabele. (T en hoogte zeespiegel)
o Absolute waarde = sterkte van verband
Hoe hoger: hoe meer op 1 lijn = perfecte lijn
Meer afwijken van de lijn = lagere correlatie
- Correlatie = 0: geen verband (binair)
1 discrete/nominale/ordinale variabele = taart, staaf of lijndiagram
1 continue variabele = histogram of boxplot
2 discrete/nominale/ordinale = tart, staaf of lijn
1 continue variabele met 1 dNO = histogram en boxplot
2 continue variabelen = scatterplot
, Betrouwbaarheidsintervallen
- Inferentiële statistiek = conclusies veraglemenen van sample naar populatie
- Confidence interval = interval van plausibele waarden voor de populatieparameter.
= 95% betrouwbaarheid interval
Parameters van CI van het gemiddelde
- Steekproefgrote
- Variantie van de variabele
- betrouwbaarheid
Hypothesetoetsing
1. Formulering nulhypothese (populatie), alternatieve hypothese (zelfde populatieparameter,
over nulhypothese) en significantieniveau (moment dat we nulhypothese verwerpen)
2. Zoek een teststatistiek en zijn verdeling (2 keer alfa/2 aan de kanten van grafiek weg)
3. Berekend de p-waarde voor geobserveerde teststatistiek
Hoe kleiner, hoe kleiner evidentie tegen H0
P < alfa (type 1 fout) = verwerp nulhypothese
4. Conclusie
Ho = gemiddelde nogsteed 14,6
Ha = gemiddelde niet gelijk aan 14,6
Alfa = 5%
S2 = 24,01
(15,9 – 14,6 ): (0,05(hier ook wortel van want wij hebben kwadraat): (wortel:147)