Statistics
Content
1. Recapitulation ..................................................................................................................................... 3
How to choose the correct statistical test: ......................................................................................... 3
How to look at data: ............................................................................................................................ 4
Effect size......................................................................................................................................... 4
X² test .............................................................................................................................................. 4
Linear regression R² ......................................................................................................................... 5
Student’s T-test ............................................................................................................................... 5
2. Two-way ANOVA ................................................................................................................................. 6
How does it work? ............................................................................................................................... 6
Interaction effect ............................................................................................................................. 6
Hypothesis: H0 and Ha ...................................................................................................................... 7
Assumptions of the two-way ANOVA.................................................................................................. 7
Factorial design ................................................................................................................................... 8
General linear model: ...................................................................................................................... 8
Total and residual Variance ............................................................................................................. 9
Degrees of freedom....................................................................................................................... 10
Planned comparison and contrasts ............................................................................................... 10
Orthogonal contrasts..................................................................................................................... 11
Standard error of contrasts ........................................................................................................... 11
Increase statistical power .............................................................................................................. 12
Types of contrast ........................................................................................................................... 12
How to interpret the results.............................................................................................................. 13
3. Multiple linear regression ................................................................................................................. 15
How does it work? ............................................................................................................................. 16
Assumptions of multiple linear regression........................................................................................ 16
Multiple regression design ................................................................................................................ 17
Dummy variables ........................................................................................................................... 17
Selection process ........................................................................................................................... 17
Model summary ............................................................................................................................ 17
Anova table of multiple linear regression ..................................................................................... 18
How to interpret the results.............................................................................................................. 18
Unstandardized regression coefficients ........................................................................................ 18
Collinearity and variance inflation................................................................................................. 19
1
, Stepwise regression: entering predictors...................................................................................... 19
Backward elemination ................................................................................................................... 21
Forward selection .......................................................................................................................... 21
4. Power analysis and sample size determination ................................................................................ 21
B.E.A.N.S ............................................................................................................................................ 21
β, Type-2 error probability ............................................................................................................ 22
Effect size....................................................................................................................................... 22
α significance level, type-1 error ................................................................................................... 23
n; sample size ................................................................................................................................ 24
S, Standard deviation, variability, σ............................................................................................... 24
Increasing statistical power ............................................................................................................... 24
5. Bayesian inference ............................................................................................................................ 25
Null hypothesis testing ...................................................................................................................... 25
Bayesian hypothesis testing .............................................................................................................. 25
Priors in Bayesian analysis ................................................................................................................. 26
How to interpreted the results.......................................................................................................... 27
Bayes factor ................................................................................................................................... 27
Using a priori belief ....................................................................................................................... 27
Beta distribution 𝐵(𝛼, 𝛽) ............................................................................................................... 29
6. Meta-analysis .................................................................................................................................... 30
Funnel plots ....................................................................................................................................... 30
Forest plots ........................................................................................................................................ 31
Heterogeneity.................................................................................................................................... 32
Meta-analysis in steps ....................................................................................................................... 33
2
, 1. Recapitulation
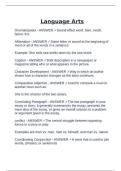
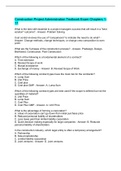
How to choose the correct statistical test:
The independent variable is the cause. Its value is independent of other variables in your study.
The dependent variable is the effect. Its value depends on changes in the independent variable.
Qualitative research is expressed in words. It is used to understand concepts, thoughts or
experiences. This type of research enables you to gather in-depth insights on topics that are not well
understood.
Nominal data is labelled into mutually exclusive categories within a variable. These
categories cannot be ordered in a meaningful way. Like way of transport: bus, train, bike, car.
Ordinal data is classified into categories within a variable that have a natural rank order.
However, the distances between the categories are uneven or unknown. For example, the
variable “frequency of physical exercise” can be categorized into the following:
1. Never 2. Rarely 3. Sometimes 4. Often 5. Always
Quantitative research is expressed in numbers and graphs. It is used to test or confirm theories and
assumptions. This type of research can be used to establish generalizable facts about a topic.
Discrete variables represent counts (e.g. the number of objects you count in a variable).
Continuous variables represent measurable amounts (e.g. water volume or weight)
3
Content
1. Recapitulation ..................................................................................................................................... 3
How to choose the correct statistical test: ......................................................................................... 3
How to look at data: ............................................................................................................................ 4
Effect size......................................................................................................................................... 4
X² test .............................................................................................................................................. 4
Linear regression R² ......................................................................................................................... 5
Student’s T-test ............................................................................................................................... 5
2. Two-way ANOVA ................................................................................................................................. 6
How does it work? ............................................................................................................................... 6
Interaction effect ............................................................................................................................. 6
Hypothesis: H0 and Ha ...................................................................................................................... 7
Assumptions of the two-way ANOVA.................................................................................................. 7
Factorial design ................................................................................................................................... 8
General linear model: ...................................................................................................................... 8
Total and residual Variance ............................................................................................................. 9
Degrees of freedom....................................................................................................................... 10
Planned comparison and contrasts ............................................................................................... 10
Orthogonal contrasts..................................................................................................................... 11
Standard error of contrasts ........................................................................................................... 11
Increase statistical power .............................................................................................................. 12
Types of contrast ........................................................................................................................... 12
How to interpret the results.............................................................................................................. 13
3. Multiple linear regression ................................................................................................................. 15
How does it work? ............................................................................................................................. 16
Assumptions of multiple linear regression........................................................................................ 16
Multiple regression design ................................................................................................................ 17
Dummy variables ........................................................................................................................... 17
Selection process ........................................................................................................................... 17
Model summary ............................................................................................................................ 17
Anova table of multiple linear regression ..................................................................................... 18
How to interpret the results.............................................................................................................. 18
Unstandardized regression coefficients ........................................................................................ 18
Collinearity and variance inflation................................................................................................. 19
1
, Stepwise regression: entering predictors...................................................................................... 19
Backward elemination ................................................................................................................... 21
Forward selection .......................................................................................................................... 21
4. Power analysis and sample size determination ................................................................................ 21
B.E.A.N.S ............................................................................................................................................ 21
β, Type-2 error probability ............................................................................................................ 22
Effect size....................................................................................................................................... 22
α significance level, type-1 error ................................................................................................... 23
n; sample size ................................................................................................................................ 24
S, Standard deviation, variability, σ............................................................................................... 24
Increasing statistical power ............................................................................................................... 24
5. Bayesian inference ............................................................................................................................ 25
Null hypothesis testing ...................................................................................................................... 25
Bayesian hypothesis testing .............................................................................................................. 25
Priors in Bayesian analysis ................................................................................................................. 26
How to interpreted the results.......................................................................................................... 27
Bayes factor ................................................................................................................................... 27
Using a priori belief ....................................................................................................................... 27
Beta distribution 𝐵(𝛼, 𝛽) ............................................................................................................... 29
6. Meta-analysis .................................................................................................................................... 30
Funnel plots ....................................................................................................................................... 30
Forest plots ........................................................................................................................................ 31
Heterogeneity.................................................................................................................................... 32
Meta-analysis in steps ....................................................................................................................... 33
2
, 1. Recapitulation
How to choose the correct statistical test:
The independent variable is the cause. Its value is independent of other variables in your study.
The dependent variable is the effect. Its value depends on changes in the independent variable.
Qualitative research is expressed in words. It is used to understand concepts, thoughts or
experiences. This type of research enables you to gather in-depth insights on topics that are not well
understood.
Nominal data is labelled into mutually exclusive categories within a variable. These
categories cannot be ordered in a meaningful way. Like way of transport: bus, train, bike, car.
Ordinal data is classified into categories within a variable that have a natural rank order.
However, the distances between the categories are uneven or unknown. For example, the
variable “frequency of physical exercise” can be categorized into the following:
1. Never 2. Rarely 3. Sometimes 4. Often 5. Always
Quantitative research is expressed in numbers and graphs. It is used to test or confirm theories and
assumptions. This type of research can be used to establish generalizable facts about a topic.
Discrete variables represent counts (e.g. the number of objects you count in a variable).
Continuous variables represent measurable amounts (e.g. water volume or weight)
3