Resource 1 - variables
1. Types of variables (nominal, ordinal, interval, ratio)
Video 1 - Variables and Types of Variables | Statistics Tutorial | MarinStatsLectures
(Links to an external site.)
Course notes (1.1)
A variable can be seen as a label name of a characteristic of, say a subject with
characteristic differs from subject to subject (subject-specific)
e.g. label = hair color. characteristics / categories = brown, blond, and red
Qualitative variables or categorical variables: nominal and ordinal
Quantitative variables or numeric variables: interval and ratio
Qualitative variables / categorical
place people into groups/categories (cannot calculate the mean)
Nominal variables
The scores are only intended to distinguish between different categories. The scores
themselves do not have any meaning.
- Categories are not ordered
- Space between scores does not have any meaning
- One cannot say that e.g. the score 2 is twice as much worth as the score 1
Ordinal variables
Nominal variables for which the categories are ordered (based on magnitude or size)
e.g. ‘Social-Economic Class’ is a variable with, say categories low, middle, and high.
Quantitative variables / numeric or continuous
Recorded numeric quantities
1. Discrete variables
Inter only: 0,1,2,3,4….
e.g. number of people in ER, number of births
, 2. Continuous variables
Measured on a continuous scale
e.g. age, weight, temperature
These two can further be divided into interval and ratio:
Interval variables
Contain the same information as nominal and ordinal variables plus the extra information
that differences between scores and can be meaningfully interpreted.
e.g. IQ is an interval variable because it contains all properties of an ordinal (and nominal)
variable, but now the difference between scores do have some objective meaning. We can
compare changes in IQ scores
e.g. temperature on the Celsius scale. From a subjective point of view (depends from subject
to subject) an increase from 10 to 20 degrees may be experienced differently than an
increase from 25 to 35 degrees.
However, 20 degrees is not twice as warm as 10 degrees. The reason for this is that ‘zero’ is
arbitrary (random) and is chosen as the freezing point of water.
Ratio variables
The ‘zero’ point is not arbitrary
e.g. age. 20 years old is twice as old as 10 years
e.g. number of brothers. Having 2 brothers is twice as much as having 1
We can compare different scores of a ratio variable because there exists a fixed zero value.
(zero of age or zero number of brothers)
,Important notes
- Identifiers
e.g. student number, employee ID
Are not true variables
- You can always convert numeric variables into categorical variables.
e.g. age -> child/adult/senior or 0-10/10-20/20-30
- Sometimes categorical variables are recorded using numbers
, Resource 2 - Histogram & bar chart
2. Histogram, bar chart
Video 2 - Bar Chart, Pie Chart, Frequency Tables | Statistics Tutorial |
MarinStatsLectures (Links to an external site.)
Video 3 - Histogram explained (Links to an external site.) (Links to an external site.)
Course notes (1.2)
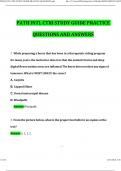
Frequency table (distribution)
A way to summarize is to create a so-called frequency
table.
- Vertically, there are columns
- Horizontally, there are rows.
Percentage, bar chart, and pie chart show the
distribution
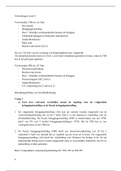
Bar chart
A bar chart is a graph with a vertical axis representing the
variable e.g. frequency (counts) and a horizontal axis
representing the scores (outcome) or number.
The bars are not connected to each other and the distance
between the bars does not have any meaning either (qualitative
variable).
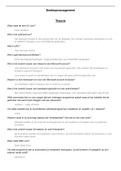
Histogram
Often used for quantitative variables.
There are no gaps between the bars, so the width of
each bar is meaningful. Figure 1.2. has a width equal
to 1.
There are more characteristics in a histogram. We
can observe, for example, that there are more
subjects scoring less than 5 because the bars on the
left side of the histogram are higher
Y-axis corresponds to the frequency or count.
X-axis corresponds classes
1. Types of variables (nominal, ordinal, interval, ratio)
Video 1 - Variables and Types of Variables | Statistics Tutorial | MarinStatsLectures
(Links to an external site.)
Course notes (1.1)
A variable can be seen as a label name of a characteristic of, say a subject with
characteristic differs from subject to subject (subject-specific)
e.g. label = hair color. characteristics / categories = brown, blond, and red
Qualitative variables or categorical variables: nominal and ordinal
Quantitative variables or numeric variables: interval and ratio
Qualitative variables / categorical
place people into groups/categories (cannot calculate the mean)
Nominal variables
The scores are only intended to distinguish between different categories. The scores
themselves do not have any meaning.
- Categories are not ordered
- Space between scores does not have any meaning
- One cannot say that e.g. the score 2 is twice as much worth as the score 1
Ordinal variables
Nominal variables for which the categories are ordered (based on magnitude or size)
e.g. ‘Social-Economic Class’ is a variable with, say categories low, middle, and high.
Quantitative variables / numeric or continuous
Recorded numeric quantities
1. Discrete variables
Inter only: 0,1,2,3,4….
e.g. number of people in ER, number of births
, 2. Continuous variables
Measured on a continuous scale
e.g. age, weight, temperature
These two can further be divided into interval and ratio:
Interval variables
Contain the same information as nominal and ordinal variables plus the extra information
that differences between scores and can be meaningfully interpreted.
e.g. IQ is an interval variable because it contains all properties of an ordinal (and nominal)
variable, but now the difference between scores do have some objective meaning. We can
compare changes in IQ scores
e.g. temperature on the Celsius scale. From a subjective point of view (depends from subject
to subject) an increase from 10 to 20 degrees may be experienced differently than an
increase from 25 to 35 degrees.
However, 20 degrees is not twice as warm as 10 degrees. The reason for this is that ‘zero’ is
arbitrary (random) and is chosen as the freezing point of water.
Ratio variables
The ‘zero’ point is not arbitrary
e.g. age. 20 years old is twice as old as 10 years
e.g. number of brothers. Having 2 brothers is twice as much as having 1
We can compare different scores of a ratio variable because there exists a fixed zero value.
(zero of age or zero number of brothers)
,Important notes
- Identifiers
e.g. student number, employee ID
Are not true variables
- You can always convert numeric variables into categorical variables.
e.g. age -> child/adult/senior or 0-10/10-20/20-30
- Sometimes categorical variables are recorded using numbers
, Resource 2 - Histogram & bar chart
2. Histogram, bar chart
Video 2 - Bar Chart, Pie Chart, Frequency Tables | Statistics Tutorial |
MarinStatsLectures (Links to an external site.)
Video 3 - Histogram explained (Links to an external site.) (Links to an external site.)
Course notes (1.2)
Frequency table (distribution)
A way to summarize is to create a so-called frequency
table.
- Vertically, there are columns
- Horizontally, there are rows.
Percentage, bar chart, and pie chart show the
distribution
Bar chart
A bar chart is a graph with a vertical axis representing the
variable e.g. frequency (counts) and a horizontal axis
representing the scores (outcome) or number.
The bars are not connected to each other and the distance
between the bars does not have any meaning either (qualitative
variable).
Histogram
Often used for quantitative variables.
There are no gaps between the bars, so the width of
each bar is meaningful. Figure 1.2. has a width equal
to 1.
There are more characteristics in a histogram. We
can observe, for example, that there are more
subjects scoring less than 5 because the bars on the
left side of the histogram are higher
Y-axis corresponds to the frequency or count.
X-axis corresponds classes