Quantitative Analysis: Visually Displaying Data Results
RSCH 8210 A-Quantitative Reasoning and Analysis
Walden University
14:48:34 GMT -05:00
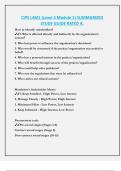
, The high school longitudinal study data set was used to identify two variables and
visually display them for comparison. In order to visually display each variable a graph of some
sort is needed. The mean of the variable X1SES (Socio-economic status composite) is .0355
displayed below in figure 1.
Figure 1
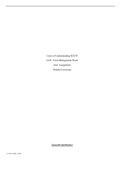
The analyzation of variables from this study can be used to determine how parents can
assist their children in their education journey. Thus, implicating a social change using the data
from the study. For the categorical variable X1PAR1EDU: Parent 1 highest level of education
was selected and displayed below in figure 2. A bar graph was selected to visually display the
highest level of education of the surveyed parents in the dataset. Based on the results of the
graph, majority of the students’ parents’ highest level of education was high school diploma or
GED.
Figure 2
14:48:34 GMT -05:00
RSCH 8210 A-Quantitative Reasoning and Analysis
Walden University
14:48:34 GMT -05:00
, The high school longitudinal study data set was used to identify two variables and
visually display them for comparison. In order to visually display each variable a graph of some
sort is needed. The mean of the variable X1SES (Socio-economic status composite) is .0355
displayed below in figure 1.
Figure 1
The analyzation of variables from this study can be used to determine how parents can
assist their children in their education journey. Thus, implicating a social change using the data
from the study. For the categorical variable X1PAR1EDU: Parent 1 highest level of education
was selected and displayed below in figure 2. A bar graph was selected to visually display the
highest level of education of the surveyed parents in the dataset. Based on the results of the
graph, majority of the students’ parents’ highest level of education was high school diploma or
GED.
Figure 2
14:48:34 GMT -05:00