7. Costs of Production
Lecture Notes
1. Explicit are accounting costs, however, Implicit Costs are the opportunity costs of
business decisions.
a. normal profit includes an opportunity cost - the profit that could have been
made in the next best alternative allocation of productive resources.
3. In other words, there is a difference between economic and accounting
cost; accountants are unconcerned with opportunity costs.
2. Time Periods are defined by the types of costs observed. These time periods
differ from industry to industry.
a. market period - everything is fixed
b. short run - there are both fixed and variable costs
c. long run - everything is variable
3. Prelude to Production Costs in Short Run - include both fixed and variable costs:
a. the law of diminishing returns is the fact that as you add variable factors of
production to a fixed factor at some point, the increases in total output
become smaller.
b. total product is the total units of production obtained from the productive
resources employed.
37
, c. average product is total product divided by the number of units of the
variable factor employed
d. marginal product is the change in total product associated with a change
in units of a variable factor
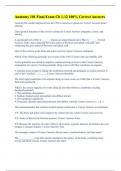
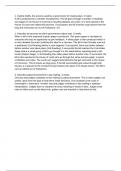
1. graphical presentation:
The top graph shows total product (total output). As total product reaches its
maximum marginal product becomes zero and then negative as total product
declines. When marginal product reaches its maximum, the total product curve
becomes flatter. As marginal product is above average product in the bottom
diagram, average product is increasing. When marginal product is below
average product, then average product is decreasing. The ranges of marginal
returns are identified on the above graphs.
38
Lecture Notes
1. Explicit are accounting costs, however, Implicit Costs are the opportunity costs of
business decisions.
a. normal profit includes an opportunity cost - the profit that could have been
made in the next best alternative allocation of productive resources.
3. In other words, there is a difference between economic and accounting
cost; accountants are unconcerned with opportunity costs.
2. Time Periods are defined by the types of costs observed. These time periods
differ from industry to industry.
a. market period - everything is fixed
b. short run - there are both fixed and variable costs
c. long run - everything is variable
3. Prelude to Production Costs in Short Run - include both fixed and variable costs:
a. the law of diminishing returns is the fact that as you add variable factors of
production to a fixed factor at some point, the increases in total output
become smaller.
b. total product is the total units of production obtained from the productive
resources employed.
37
, c. average product is total product divided by the number of units of the
variable factor employed
d. marginal product is the change in total product associated with a change
in units of a variable factor
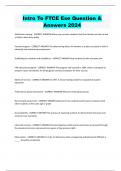
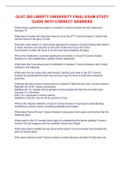
1. graphical presentation:
The top graph shows total product (total output). As total product reaches its
maximum marginal product becomes zero and then negative as total product
declines. When marginal product reaches its maximum, the total product curve
becomes flatter. As marginal product is above average product in the bottom
diagram, average product is increasing. When marginal product is below
average product, then average product is decreasing. The ranges of marginal
returns are identified on the above graphs.
38