Summary paleoclimatology
Lecture 1 – framework of climate science
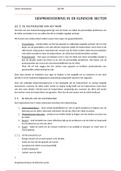
Changes in biosphere: Lots of chlorophyl means lots of productivity. Along African coastlines →
upwelling and lots of productivity.
Changes in land surface: dust that travels from Sahara to Amazonian. Brings phosphorus to
phosphorus poor Amazonian. Amount of dust related to rainfall in Sahara.
1369W/m2 arrives at earth surface. But earth is a rotating sphere, so average is 342 W/m2
Shortwave radiation in, longwave radiation out.
,Atmospheric composition: N2 = 78% ; O2 = 21% ; H2Ov = <1% (GHG) ; CO2 = 0.04%(GHG) ; CH4 =
0.00018% (GHG)
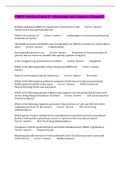
Imbalance between poles and equator: low latitudes more solar radiation arrives and absorbed. In
tropical zones more clouds and more reflection (clouds related to ITC). Reflection by earth’s surface
much higher in polar regions. In total: heat gain and heat loss. Energy is transported from net low to
high latitude.
Sensible heat = product of temperature of the air and its specific heat by moving air
Latent heat = Initial evaporation of water and storage of heat in water vapour, release of heat during
condensation and precipitation. Heat related to phase transition.
Why study past climates?
- Model validation (models to predict the future. They are becoming better but we can only
test them on ancient climates.)
- Forcing a response (some components have longer response times than others )
- Climate sensitivity (there are ideas, but better constraints are needed. This sensitivity can be
dependent on the background climate state)
- Tipping points (hard to predict. Are there critical thresholds? We can only detect this by
longer time series in the past)
ESM = Earth System Model (interactions of all different models)
Response time : time needed to reach 50% of the “new” temperature.
Time lag = time between the initial forcing and the response
Past observations and archives:
- Instrumental records (long term observations. Weather stations)
- Historical (archives, paintings)
- Trees (studying the tree rings, gives information about carbon uptake and wetness (?))
- Corals (drillings. They show bended seasonal cycles. Give information about temperature and
salinity changes. Also about flooding)
- Ice (drillings in ice caps. One of the best archives)
- Speleothems (records obtained from caves. Drillings in stalagmites and stalactites. )
- Sediments (continental and marine)
Lecture 2 – Tectonic-scale climate change
Earth has remained habitable throughout its history becayse unique situation in respect to distance
of the sun. In comparison to Venus: Venus has a very dense atmosphere and much more radiation is
immediately reflected → less radiation enters atmosphere than on earth. But Venus has much more
GHGs, so temperature much higher.
,Temperature on earth without GHG’s would be much lower.
5 billion years ago, sun intensity was 70% of what it is now. There was a weaker radiation, but a
stronger greenhouse. Currently, the CO2 is kept in rocks (weathering), so the greenhouse is weaker.
Reconstruction of the Earth’s atmosphere composition over time. 4.3 billion years ago, much more
GHG. 2.5 byr ago, oxygenation event
Oxygen source:
-photosynthesis (evolution of plants).
-Iron solutions in oceans. Binds the oxygen and works as a sink. Then precipitates at bottom of the
ocean. 2 byr ago, almost all iron had been bound. After that O2 levels increase.
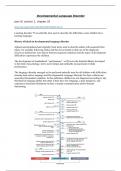
Carbon reservoirs Carbon fluxes
Sediments is the largest carbon reservoir.
Very slow transfer between deep ocean and sediments and rocks, and sediments and rocks and
atmosphere → long term carbon cycle.
Also exchange between deep ocean and mixed layer.
Gaia hypothesis = all living things on earth (biosphere) function as one superorganism that chanes its
environmnet to create conditions that best meet its needs, with the ability to self-regulate critical
sustems needed to sustain life.
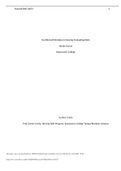
Long term carbon cycle:
CO2 in atmosphere due to volcanism → rock weathering → Carbon again transported into sea
(tectonic movements) → subduction and melting → volcanism.
Rock weathering process
, Silicate bedrock reacts with Carbonic acid → dissolve in ions. Transported into ocean.
2 carbonic acis in silicate weathering and only one comes free in carbonate precipitation → use 1
molecule actively.
Carbonate weathering uses 1 and 1 comes free → so no active use.
Snowball earth : Did earth freeze completely?
The first time when photosynthesis started: increase in O2 and decrease in CO2.
Geographical reconstructions: all continents in equatorial regions, so even on equator ice? Very
different obliquity seems o be impossible
1. Increase in productivity or change in long term carbon cycle → decrease in CO2. (because all
continents were around the equator, high humidity and temperatures → higher weathering
rate?)
2. Building of ice caps due to CO2 decline. Below a certain threshols of where the ice reaches →
albedo so high that almost all radiation is reflected (albedo was around 70%!!)→ snowball
situation. Also, much ocean water frozen → hydrological cycle/ocean circulation slowed
down/stopped. Also the rocks are frozen, so no fluxes. Weathering rates decline
3. Very low weathering rates. CO2 buildup because of volcanism. This CO2 increase has got
more effect than albedo. Then snowball earth melts very rapdily.
4. Albedo has declines, intense hydrological cycle, much weathering (climate much warmer, so
higher rates).
Lecture 1 – framework of climate science
Changes in biosphere: Lots of chlorophyl means lots of productivity. Along African coastlines →
upwelling and lots of productivity.
Changes in land surface: dust that travels from Sahara to Amazonian. Brings phosphorus to
phosphorus poor Amazonian. Amount of dust related to rainfall in Sahara.
1369W/m2 arrives at earth surface. But earth is a rotating sphere, so average is 342 W/m2
Shortwave radiation in, longwave radiation out.
,Atmospheric composition: N2 = 78% ; O2 = 21% ; H2Ov = <1% (GHG) ; CO2 = 0.04%(GHG) ; CH4 =
0.00018% (GHG)
Imbalance between poles and equator: low latitudes more solar radiation arrives and absorbed. In
tropical zones more clouds and more reflection (clouds related to ITC). Reflection by earth’s surface
much higher in polar regions. In total: heat gain and heat loss. Energy is transported from net low to
high latitude.
Sensible heat = product of temperature of the air and its specific heat by moving air
Latent heat = Initial evaporation of water and storage of heat in water vapour, release of heat during
condensation and precipitation. Heat related to phase transition.
Why study past climates?
- Model validation (models to predict the future. They are becoming better but we can only
test them on ancient climates.)
- Forcing a response (some components have longer response times than others )
- Climate sensitivity (there are ideas, but better constraints are needed. This sensitivity can be
dependent on the background climate state)
- Tipping points (hard to predict. Are there critical thresholds? We can only detect this by
longer time series in the past)
ESM = Earth System Model (interactions of all different models)
Response time : time needed to reach 50% of the “new” temperature.
Time lag = time between the initial forcing and the response
Past observations and archives:
- Instrumental records (long term observations. Weather stations)
- Historical (archives, paintings)
- Trees (studying the tree rings, gives information about carbon uptake and wetness (?))
- Corals (drillings. They show bended seasonal cycles. Give information about temperature and
salinity changes. Also about flooding)
- Ice (drillings in ice caps. One of the best archives)
- Speleothems (records obtained from caves. Drillings in stalagmites and stalactites. )
- Sediments (continental and marine)
Lecture 2 – Tectonic-scale climate change
Earth has remained habitable throughout its history becayse unique situation in respect to distance
of the sun. In comparison to Venus: Venus has a very dense atmosphere and much more radiation is
immediately reflected → less radiation enters atmosphere than on earth. But Venus has much more
GHGs, so temperature much higher.
,Temperature on earth without GHG’s would be much lower.
5 billion years ago, sun intensity was 70% of what it is now. There was a weaker radiation, but a
stronger greenhouse. Currently, the CO2 is kept in rocks (weathering), so the greenhouse is weaker.
Reconstruction of the Earth’s atmosphere composition over time. 4.3 billion years ago, much more
GHG. 2.5 byr ago, oxygenation event
Oxygen source:
-photosynthesis (evolution of plants).
-Iron solutions in oceans. Binds the oxygen and works as a sink. Then precipitates at bottom of the
ocean. 2 byr ago, almost all iron had been bound. After that O2 levels increase.
Carbon reservoirs Carbon fluxes
Sediments is the largest carbon reservoir.
Very slow transfer between deep ocean and sediments and rocks, and sediments and rocks and
atmosphere → long term carbon cycle.
Also exchange between deep ocean and mixed layer.
Gaia hypothesis = all living things on earth (biosphere) function as one superorganism that chanes its
environmnet to create conditions that best meet its needs, with the ability to self-regulate critical
sustems needed to sustain life.
Long term carbon cycle:
CO2 in atmosphere due to volcanism → rock weathering → Carbon again transported into sea
(tectonic movements) → subduction and melting → volcanism.
Rock weathering process
, Silicate bedrock reacts with Carbonic acid → dissolve in ions. Transported into ocean.
2 carbonic acis in silicate weathering and only one comes free in carbonate precipitation → use 1
molecule actively.
Carbonate weathering uses 1 and 1 comes free → so no active use.
Snowball earth : Did earth freeze completely?
The first time when photosynthesis started: increase in O2 and decrease in CO2.
Geographical reconstructions: all continents in equatorial regions, so even on equator ice? Very
different obliquity seems o be impossible
1. Increase in productivity or change in long term carbon cycle → decrease in CO2. (because all
continents were around the equator, high humidity and temperatures → higher weathering
rate?)
2. Building of ice caps due to CO2 decline. Below a certain threshols of where the ice reaches →
albedo so high that almost all radiation is reflected (albedo was around 70%!!)→ snowball
situation. Also, much ocean water frozen → hydrological cycle/ocean circulation slowed
down/stopped. Also the rocks are frozen, so no fluxes. Weathering rates decline
3. Very low weathering rates. CO2 buildup because of volcanism. This CO2 increase has got
more effect than albedo. Then snowball earth melts very rapdily.
4. Albedo has declines, intense hydrological cycle, much weathering (climate much warmer, so
higher rates).