Week 1- Bivariate Linear Regression
I. Models
Models
= Models are statistical abstractions
● They enable us to make predictions, summarize relationships, and test causal claims in a
sample of data
● Provided some further assumptions hold, they also let us extrapolate claims to a broader
population
● Basic structure of a model: data = model + error
● We want a model that most efficiently and accurately describes the data...although these goals
can be in tension!
Usage of models – We use statistical models to explore associations and summarize relationships
between variables
Types of Regression Model
● Ordinary least squares (OLS): Modeling continuous dependent variables
● Logit models: Modeling binary outcome variables
● Multinomial and ordered/ordinal logit models: Modeling categorical and ordinal dependent
variables
II. Linear Regression
Types of Variables
1. The variable we want to predict/explain/understand (Y)
● Dependent variable
● DV
● Outcome variable
2. The variable we’re using to predict/explain the outcome (X)
● Independent variable
● IV
● Predictor variable
● When we add additional variables to the model: control variables; covariates; X1, X2; Z
Regression Line
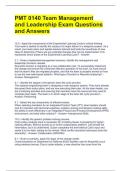
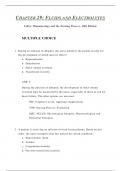
The simplest model we can use is a straight line, which we can
represent via this formula:
y = a + bx
● a = the constant/intercept
● b = the slope of the line
Constant/intercept
If X = 0, what value should we expect Y to be on average according to the model?
Here: 51
1
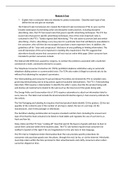
,Slope
Slope or b – How should we expect Y to change on average for each one unit change in X according to
the model?
Here: 0.62.
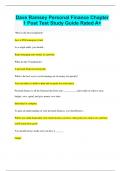
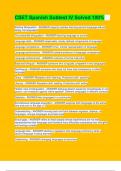
Error/Residual
Difference between what the model predicts and the observed value;
they are prediction errors
The sample Regression Equation
● b0 = the constant/intercept = average or (expected) value of Y when X =0 in our data
● b1 = slope of the line = average change in Y given a one unit change in X in our data
● εi = residual error
Which one is the best line? – The one that explains the data best.
OLS – Least Squares Regression Models
OLS – The regression line that minimizes the sum of the squared residuals (SSR) or sum of squared
prediction errors
III. Interpreting Coefficients and Making Predictions
Types of Independent Variable in OLS
● Statistics I: Tests depending on nature of independent (and dependent) variable
○ Continuous DV and indicator/binary IV: t-test
○ Continuous DV and nominal IV: ANOVA
○ Continuous DV and IV: correlation
● Linear Regression:
○ DV – continuous
○ IVs – binary, continuous, nominal, or ordinal
● Logistic and Multinomial Logistic Regression for
○ DV – Binary/Nominal
Coefficients
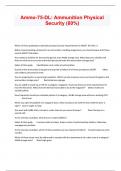
Bivariate regression for continuous variables
Bivariate Regression Coefficient and Correlation Coefficient
The bivariate regression coefficient is an unstandardized version of the correlation coefficient
2
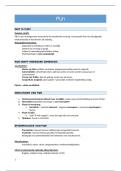
, ➔ Formula to calculate coefficient
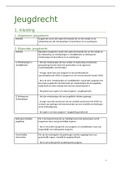
The Constant or Y-Intercept Term
The constant or y-intercept term estimates the average value of Y when X = 0
● Example – Model with just ideology: The constant (= 3.979) indicates the average value of Y
when Ideology = 0. Here: respondents with the most left-wing self-placement on the ideology
scale
Two Cautions about the Constant
1. Don’t interpret the slope coefficient as saying something about the constant
● Mistake: “In model 1, it can be seen that a 1 unit increase of [the IV] leads to a 0.114 unit
increase of the constant”
● The constant gives the mean value of the DV when X = 0; the slope for an IV tells us how Y
changes on average for each one unit increase in X
2. Values for b0 (the constant) may not be that meaningful if the IV(s) cannot/does not take on a score
of 0
● As a general rule, we probably don’t care all that much about what specific value the constant
takes beyond its use in calculating predictions from the model
Predictions
The regression equation enables us to describe the relationship between an IV and a DV
via the slope coefficient (b1)
The regression equation also enables us to make specific predictions for what value we should expect Y
to take on for any given value of X
IV. Coefficients and Inference
From Description to Inference
● The coefficients in our regression model summarize or describe the relationship between X and
Y in our data/sample
● We can also use other output from the model (e.g., standard errors) to make inferences to an
underlying population (contingent on some assumptions)
3
I. Models
Models
= Models are statistical abstractions
● They enable us to make predictions, summarize relationships, and test causal claims in a
sample of data
● Provided some further assumptions hold, they also let us extrapolate claims to a broader
population
● Basic structure of a model: data = model + error
● We want a model that most efficiently and accurately describes the data...although these goals
can be in tension!
Usage of models – We use statistical models to explore associations and summarize relationships
between variables
Types of Regression Model
● Ordinary least squares (OLS): Modeling continuous dependent variables
● Logit models: Modeling binary outcome variables
● Multinomial and ordered/ordinal logit models: Modeling categorical and ordinal dependent
variables
II. Linear Regression
Types of Variables
1. The variable we want to predict/explain/understand (Y)
● Dependent variable
● DV
● Outcome variable
2. The variable we’re using to predict/explain the outcome (X)
● Independent variable
● IV
● Predictor variable
● When we add additional variables to the model: control variables; covariates; X1, X2; Z
Regression Line
The simplest model we can use is a straight line, which we can
represent via this formula:
y = a + bx
● a = the constant/intercept
● b = the slope of the line
Constant/intercept
If X = 0, what value should we expect Y to be on average according to the model?
Here: 51
1
,Slope
Slope or b – How should we expect Y to change on average for each one unit change in X according to
the model?
Here: 0.62.
Error/Residual
Difference between what the model predicts and the observed value;
they are prediction errors
The sample Regression Equation
● b0 = the constant/intercept = average or (expected) value of Y when X =0 in our data
● b1 = slope of the line = average change in Y given a one unit change in X in our data
● εi = residual error
Which one is the best line? – The one that explains the data best.
OLS – Least Squares Regression Models
OLS – The regression line that minimizes the sum of the squared residuals (SSR) or sum of squared
prediction errors
III. Interpreting Coefficients and Making Predictions
Types of Independent Variable in OLS
● Statistics I: Tests depending on nature of independent (and dependent) variable
○ Continuous DV and indicator/binary IV: t-test
○ Continuous DV and nominal IV: ANOVA
○ Continuous DV and IV: correlation
● Linear Regression:
○ DV – continuous
○ IVs – binary, continuous, nominal, or ordinal
● Logistic and Multinomial Logistic Regression for
○ DV – Binary/Nominal
Coefficients
Bivariate regression for continuous variables
Bivariate Regression Coefficient and Correlation Coefficient
The bivariate regression coefficient is an unstandardized version of the correlation coefficient
2
, ➔ Formula to calculate coefficient
The Constant or Y-Intercept Term
The constant or y-intercept term estimates the average value of Y when X = 0
● Example – Model with just ideology: The constant (= 3.979) indicates the average value of Y
when Ideology = 0. Here: respondents with the most left-wing self-placement on the ideology
scale
Two Cautions about the Constant
1. Don’t interpret the slope coefficient as saying something about the constant
● Mistake: “In model 1, it can be seen that a 1 unit increase of [the IV] leads to a 0.114 unit
increase of the constant”
● The constant gives the mean value of the DV when X = 0; the slope for an IV tells us how Y
changes on average for each one unit increase in X
2. Values for b0 (the constant) may not be that meaningful if the IV(s) cannot/does not take on a score
of 0
● As a general rule, we probably don’t care all that much about what specific value the constant
takes beyond its use in calculating predictions from the model
Predictions
The regression equation enables us to describe the relationship between an IV and a DV
via the slope coefficient (b1)
The regression equation also enables us to make specific predictions for what value we should expect Y
to take on for any given value of X
IV. Coefficients and Inference
From Description to Inference
● The coefficients in our regression model summarize or describe the relationship between X and
Y in our data/sample
● We can also use other output from the model (e.g., standard errors) to make inferences to an
underlying population (contingent on some assumptions)
3