Lieve Göbbels
Cognitive Science II (JBC090)
Semester 1, 2021-2022
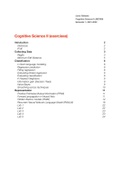
Cognitive Science II (exercises)
Introduction 2
Distances 2
tf*idf 2
Collecting Data 3
RegEx 3
Minimum Edit Distance 5
Classi cation 6
n-Gram language modeling 6
Regression prediction 8
Fitting regression 8
Evaluating (linear) regression 8
Evaluating classi cation 8
K-Nearest Neighbors 9
Information gain (Decision Trees) 9
Naive Bayes 9
Smoothing across techniques 10
Representation 11
Positive Pointwise Mutual Information (PPMI) 11
Forward propagation in Neural Nets 11
Hidden Markov models (HMM) 14
Recurrent Neural Network Language Model (RNNLM) 18
Lab 1 22
Lab 2 22
Lab 3 23
Lab 4 23
Lab 5 24
, Introduction
In short:
• Distances
• tf*idf
Distances
n
( p i⃗ − q i⃗ )2
∑
Euclidian Distance:
i=1
|A ∩ B|
Jaccard coe cient: J(A, B) =
|A ∪ B|
p⃗∙ q⃗ n
p i⃗ ⋅ q i⃗
∑
Cosine Similarity: where ∙=
p⃗∙ p⃗⋅ q ⃗∙ q ⃗ i=1
Note: p ⃗ ∙ p ⃗ is the ℓ2 norm for vector p .⃗ If one ℓ2 normalizes the full space, the denominator
drops and the cosine similarity becomes: ∥ p ⃗∥2 ∙ ∥ q ⃗∥2
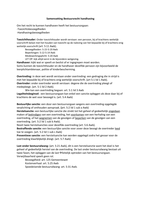
tf*idf
N
wt,d = log(tf(t, d ) + 1) ⋅ logb dft
where tf = term frequency
df = document frequency
N = number of documents
b = base; typically 10 (log = ln; log10 = lg)
The term frequency refers to how many times the term t occurs in a document d. The document
frequency refers to in how many documents the term t occurs. When making a term frequency
matrix, the unique words (the vocabulary; features) are listed in the columns and the documents (or
their numbers, e.g. doc1, doc2) are listed in the rows. The values in the matrix are the counts of each
word in a particular document.
the cat sat on mat my
doc1 (the cat sat on the mat) 2 1 1 1 1 0
doc2 (my cat sat on my cat) 0 2 1 1 0 2
Using the aforementioned formula (wt,d), one can convert this tf matrix to a tf * idf matrix. For
example, wthe,1 = ln(2 + 1) ⋅ lg( 21 ) = 0.331.
Cognitive Science II (JBC090)
Semester 1, 2021-2022
Cognitive Science II (exercises)
Introduction 2
Distances 2
tf*idf 2
Collecting Data 3
RegEx 3
Minimum Edit Distance 5
Classi cation 6
n-Gram language modeling 6
Regression prediction 8
Fitting regression 8
Evaluating (linear) regression 8
Evaluating classi cation 8
K-Nearest Neighbors 9
Information gain (Decision Trees) 9
Naive Bayes 9
Smoothing across techniques 10
Representation 11
Positive Pointwise Mutual Information (PPMI) 11
Forward propagation in Neural Nets 11
Hidden Markov models (HMM) 14
Recurrent Neural Network Language Model (RNNLM) 18
Lab 1 22
Lab 2 22
Lab 3 23
Lab 4 23
Lab 5 24
, Introduction
In short:
• Distances
• tf*idf
Distances
n
( p i⃗ − q i⃗ )2
∑
Euclidian Distance:
i=1
|A ∩ B|
Jaccard coe cient: J(A, B) =
|A ∪ B|
p⃗∙ q⃗ n
p i⃗ ⋅ q i⃗
∑
Cosine Similarity: where ∙=
p⃗∙ p⃗⋅ q ⃗∙ q ⃗ i=1
Note: p ⃗ ∙ p ⃗ is the ℓ2 norm for vector p .⃗ If one ℓ2 normalizes the full space, the denominator
drops and the cosine similarity becomes: ∥ p ⃗∥2 ∙ ∥ q ⃗∥2
tf*idf
N
wt,d = log(tf(t, d ) + 1) ⋅ logb dft
where tf = term frequency
df = document frequency
N = number of documents
b = base; typically 10 (log = ln; log10 = lg)
The term frequency refers to how many times the term t occurs in a document d. The document
frequency refers to in how many documents the term t occurs. When making a term frequency
matrix, the unique words (the vocabulary; features) are listed in the columns and the documents (or
their numbers, e.g. doc1, doc2) are listed in the rows. The values in the matrix are the counts of each
word in a particular document.
the cat sat on mat my
doc1 (the cat sat on the mat) 2 1 1 1 1 0
doc2 (my cat sat on my cat) 0 2 1 1 0 2
Using the aforementioned formula (wt,d), one can convert this tf matrix to a tf * idf matrix. For
example, wthe,1 = ln(2 + 1) ⋅ lg( 21 ) = 0.331.