Definition
• Measures of dispersion are descriptive
statistics that describe how similar a set of
scores are to each other
– The more similar the scores are to each other, the
lower the measure of dispersion will be
– The less similar the scores are to each other, the
higher the measure of dispersion will be
– In general, the more spread out a distribution is,
the larger the measure of dispersion will be
1
, Why Study Dispersion?
– A measure of location, such as the mean or the median,
only describes the center of the data. It is valuable from
that standpoint, but it does not tell us anything about the
spread of the data.
– For example, if your nature guide told you that the river
ahead averaged 3 feet in depth, would you want to wade
across on foot without additional information? Probably
not. You would want to know something about the variation
in the depth.
– A second reason for studying the dispersion in a set of data
is to compare the spread in two or more distributions.
2
, Measures of Dispersion
• Which of the 125
distributions of scores 100
75
has the larger 50
25
dispersion? 0
1 2 3 4 5 6 7 8 9 10
The upper distribution
has more dispersion 125
100
because the scores are 75
50
more spread out 25
0
1 2 3 4 5 6 7 8 9 10
That is, they are less
similar to each other
3
, Measures of Dispersion
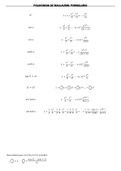
1. Absolute measures of dispersion
The range
The semi-interquartile range (SIR)
Mean deviation
Variance / standard deviation
2. Relative measures of dispersion
Coefficient of range,
Coefficient of I.Q
Coefficient of variation
4
• Measures of dispersion are descriptive
statistics that describe how similar a set of
scores are to each other
– The more similar the scores are to each other, the
lower the measure of dispersion will be
– The less similar the scores are to each other, the
higher the measure of dispersion will be
– In general, the more spread out a distribution is,
the larger the measure of dispersion will be
1
, Why Study Dispersion?
– A measure of location, such as the mean or the median,
only describes the center of the data. It is valuable from
that standpoint, but it does not tell us anything about the
spread of the data.
– For example, if your nature guide told you that the river
ahead averaged 3 feet in depth, would you want to wade
across on foot without additional information? Probably
not. You would want to know something about the variation
in the depth.
– A second reason for studying the dispersion in a set of data
is to compare the spread in two or more distributions.
2
, Measures of Dispersion
• Which of the 125
distributions of scores 100
75
has the larger 50
25
dispersion? 0
1 2 3 4 5 6 7 8 9 10
The upper distribution
has more dispersion 125
100
because the scores are 75
50
more spread out 25
0
1 2 3 4 5 6 7 8 9 10
That is, they are less
similar to each other
3
, Measures of Dispersion
1. Absolute measures of dispersion
The range
The semi-interquartile range (SIR)
Mean deviation
Variance / standard deviation
2. Relative measures of dispersion
Coefficient of range,
Coefficient of I.Q
Coefficient of variation
4