Content
Questions ……………………….…………………………………………………………….2
Week 1…………………………………………………………………………………………2
Week 2………………………………………………………....................................................6
Week 3…………………………………………………………………………………………6
Week 4…………………………………………………………………………………………7
Week 5…………………………………………………………………………………………7
Week 6………………………………………………………………………………………..12
Questions and answers……………………………………………………………………...15
Week 1………………………………………………………………………………………..15
Week 2………………………………………………………..................................................18
Week 3………………………………………………………………………………………..19
Week 4………………………………………………………………………………………..20
Week 5………………………………………………………………………………………..20
Week 6………………………………………………………………………………………..25
1
,Questions
Week 1
1. What is the difference between descriptive and inferential statistics?
Descriptive statistics are graphs, tables, and numerical summaries such as means and
percentages that are used to easily describe data and make it understandable. Statistical
inferences (inferential statistics) are predictions about a population using data from a
sample of that population.
2. What is the difference between validity and reliability?
A measurement must have validity and reliability. Validity means that the
measurement must measure what it intends to measure. A lack of validity leads to bias.
Reliability implies that the measurement must be consistent in the sense that a subject
gives the same answer when asked again. A lack of reliability leads to errors.
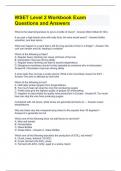
3. What are the four different measurement levels and their associated properties?
Enables Enables Uses equal Has real zero
categorization ranking intervals point
Nominal X
Ordinal X X
Interval X X X
Ratio X X X X
4. What is the difference between discrete and continuous variables?
A variable is discrete if its possible values form a series of discrete numbers with spaces
between them. A variable is continuous if it can have an infinite continuum of possible
real numbers (including decimals).
5. What are the three types of bias that can lead to different results from sample to sample?
• Sampling bias. In non-probability samples, it is not possible to determine the
probabilities of the possible samples. Non-probability sampling leads to sample
bias. There are three types of non-probability sampling:
o Voluntary sampling. Only volunteers as test subjects.
o Selection bias. Only one type of subject.
o Underrepresentation. The sample lacks representation of some groups
within the population.
• Response bias. Poorly worded or confusing questions (or other outside
influences) cause people to answer incorrectly.
• Non-response bias. This happens when some of the subjects cannot be reached or
refuse to participate, resulting in missing data.
2
, 6. What is systematic random sampling?
This method consists of three steps:
1. Skip number (k) = population (N) / sample (n)
2. Randomly select a subject from the first k names in the sampling frame.
3. Select every kth topic listed next.
7. What are stratified random samples and when are they (dis)proportionate?
Stratified random sampling is a type of probability sampling where the population is
divided into separate groups called strata and then a simple random sample is selected
from each stratum. Stratified random samples are proportional if the proportions of the
strata are the same as those in the entire population. Stratified random samples are
disproportionate if the proportions of the strata differ from the population proportions;
this is used when the group is such a small part of the population that it may not be
sufficiently represented in a simple random sample to allow for accurate inferences.
8. What are cluster samples?
Cluster sampling is a type of probability sampling; it divides the population into a large
number of clusters, such as city blocks, and selects a random sample of clusters in which
all people are used as subjects in the sample.
9. What is multi-stage sampling?
A type of probability sampling: Clusters are randomly selected and people within those
clusters are randomly selected as subjects.
10. What is the empirical rule?
The empirical rule states that if a histogram is bell-shaped, then;
1. About 68% of the observations lie between 𝒚 ̅ − 𝒔and 𝒚
̅ + 𝒔.
2. About 95% of the observations lie between 𝒚 ̅ − 𝟐𝒔 and 𝒚
̅ + 𝟐𝒔.
̅ − 𝟑𝒔and 𝒚
3. All or almost all observations lie between 𝒚 ̅ + 𝟑𝒔.
3
Questions ……………………….…………………………………………………………….2
Week 1…………………………………………………………………………………………2
Week 2………………………………………………………....................................................6
Week 3…………………………………………………………………………………………6
Week 4…………………………………………………………………………………………7
Week 5…………………………………………………………………………………………7
Week 6………………………………………………………………………………………..12
Questions and answers……………………………………………………………………...15
Week 1………………………………………………………………………………………..15
Week 2………………………………………………………..................................................18
Week 3………………………………………………………………………………………..19
Week 4………………………………………………………………………………………..20
Week 5………………………………………………………………………………………..20
Week 6………………………………………………………………………………………..25
1
,Questions
Week 1
1. What is the difference between descriptive and inferential statistics?
Descriptive statistics are graphs, tables, and numerical summaries such as means and
percentages that are used to easily describe data and make it understandable. Statistical
inferences (inferential statistics) are predictions about a population using data from a
sample of that population.
2. What is the difference between validity and reliability?
A measurement must have validity and reliability. Validity means that the
measurement must measure what it intends to measure. A lack of validity leads to bias.
Reliability implies that the measurement must be consistent in the sense that a subject
gives the same answer when asked again. A lack of reliability leads to errors.
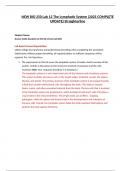
3. What are the four different measurement levels and their associated properties?
Enables Enables Uses equal Has real zero
categorization ranking intervals point
Nominal X
Ordinal X X
Interval X X X
Ratio X X X X
4. What is the difference between discrete and continuous variables?
A variable is discrete if its possible values form a series of discrete numbers with spaces
between them. A variable is continuous if it can have an infinite continuum of possible
real numbers (including decimals).
5. What are the three types of bias that can lead to different results from sample to sample?
• Sampling bias. In non-probability samples, it is not possible to determine the
probabilities of the possible samples. Non-probability sampling leads to sample
bias. There are three types of non-probability sampling:
o Voluntary sampling. Only volunteers as test subjects.
o Selection bias. Only one type of subject.
o Underrepresentation. The sample lacks representation of some groups
within the population.
• Response bias. Poorly worded or confusing questions (or other outside
influences) cause people to answer incorrectly.
• Non-response bias. This happens when some of the subjects cannot be reached or
refuse to participate, resulting in missing data.
2
, 6. What is systematic random sampling?
This method consists of three steps:
1. Skip number (k) = population (N) / sample (n)
2. Randomly select a subject from the first k names in the sampling frame.
3. Select every kth topic listed next.
7. What are stratified random samples and when are they (dis)proportionate?
Stratified random sampling is a type of probability sampling where the population is
divided into separate groups called strata and then a simple random sample is selected
from each stratum. Stratified random samples are proportional if the proportions of the
strata are the same as those in the entire population. Stratified random samples are
disproportionate if the proportions of the strata differ from the population proportions;
this is used when the group is such a small part of the population that it may not be
sufficiently represented in a simple random sample to allow for accurate inferences.
8. What are cluster samples?
Cluster sampling is a type of probability sampling; it divides the population into a large
number of clusters, such as city blocks, and selects a random sample of clusters in which
all people are used as subjects in the sample.
9. What is multi-stage sampling?
A type of probability sampling: Clusters are randomly selected and people within those
clusters are randomly selected as subjects.
10. What is the empirical rule?
The empirical rule states that if a histogram is bell-shaped, then;
1. About 68% of the observations lie between 𝒚 ̅ − 𝒔and 𝒚
̅ + 𝒔.
2. About 95% of the observations lie between 𝒚 ̅ − 𝟐𝒔 and 𝒚
̅ + 𝟐𝒔.
̅ − 𝟑𝒔and 𝒚
3. All or almost all observations lie between 𝒚 ̅ + 𝟑𝒔.
3