Exam (elaborations)
Grand Canyon UniversityHLT 362VModule 5 Ex 29and35 (90points)
Rating
Sold
-
Pages
4
Uploaded on
17-03-2022
Written in
2021/2022
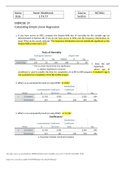
1. If you have access to SPSS, compute the Shapiro-Wilk test of normality for the variable age (as demonstrated in Exercise 26). If you do not have access to SPSS, plot the frequency distributions by hand. What do the results indicate? The frequency distribution was not statistically significant as the Shapiro-Wilk p value was 0.357.
Show more
Read less
Institution
Grand Canyon University
Course
HLT 362V
Whoops! We can’t load your doc right now. Try again or contact support.
Written for
- Institution
-
Grand Canyon University
- Course
-
HLT 362V
Document information
- Uploaded on
- March 17, 2022
- Number of pages
- 4
- Written in
- 2021/2022
- Type
- Exam (elaborations)
- Contains
- Unknown
Subjects
$8.99
Get access to the full document:
100% satisfaction guarantee
Immediately available after payment
Both online and in PDF
No strings attached
Also available in package deal
Package deal
Grand Canyon University - HLT 362V | HLT 362 | HLT362 | HLT362V QUIZ 1, 2, 3 WEEK 4 DISCUSSION QUESTIONS
6
2022
$ 56.94
More info