Carol Lynne Cates
Week 5 Assignment: Lab
Summer 2019
Statistical Reasoning
Varalakshmi Balaji, Instructor
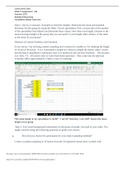
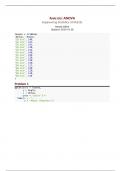
Step 1: Survey or measure 10 people to find their heights. Determine the mean and standard
deviation for this group by using the Week 3 Excel spreadsheet. Post a screen shot of the portion
of the spreadsheet that helped you determine these values. How does your height compare to the
mean (average) height of the group that you surveyed? Is your height taller, shorter, or the same
as the mean of your group?
Measure of Central Tendency and Variation:
In my survey I am utilizing random sampling and a numerical variable as I’m studying the height
of 10 out of 50 nurses. It is a convenience sample as I chose to sample the nurses where I work,
and the data is quantitative continuous since it is numerical and can have fractions. The location
was Tyler, TX. All nurses were in work-from-home positions. They come into the physical
corporate office approximately 3 times a year for meetings.
The mean height in my spreadsheet is 64.80”. I am 60” therefore, I am 4.80” shorter the mean
height of my group.
Step 2: Give some background information on the group of people you used in your study. You
might consider using the following questions to guide your answer.
a. How did you choose the participants for your study (sampling method)?
I chose a random sampling of 10 nurses from the 50 registered nurses that I worked with.
This study source was downloaded by 100000770861734 from CourseHero.com on 02-08-2022 11:57:45 GMT -06:00
https://www.coursehero.com/file/44874591/Week-5-Lab-Assignmentdocx/
Week 5 Assignment: Lab
Summer 2019
Statistical Reasoning
Varalakshmi Balaji, Instructor
Step 1: Survey or measure 10 people to find their heights. Determine the mean and standard
deviation for this group by using the Week 3 Excel spreadsheet. Post a screen shot of the portion
of the spreadsheet that helped you determine these values. How does your height compare to the
mean (average) height of the group that you surveyed? Is your height taller, shorter, or the same
as the mean of your group?
Measure of Central Tendency and Variation:
In my survey I am utilizing random sampling and a numerical variable as I’m studying the height
of 10 out of 50 nurses. It is a convenience sample as I chose to sample the nurses where I work,
and the data is quantitative continuous since it is numerical and can have fractions. The location
was Tyler, TX. All nurses were in work-from-home positions. They come into the physical
corporate office approximately 3 times a year for meetings.
The mean height in my spreadsheet is 64.80”. I am 60” therefore, I am 4.80” shorter the mean
height of my group.
Step 2: Give some background information on the group of people you used in your study. You
might consider using the following questions to guide your answer.
a. How did you choose the participants for your study (sampling method)?
I chose a random sampling of 10 nurses from the 50 registered nurses that I worked with.
This study source was downloaded by 100000770861734 from CourseHero.com on 02-08-2022 11:57:45 GMT -06:00
https://www.coursehero.com/file/44874591/Week-5-Lab-Assignmentdocx/