Summary of the material for the final exam (2022) for Statistics II: Applied Quantitative Analysis.
INCLUDES Q&A lectures, web lectures and seminar notes from week 1-6 (Total: 43 pages).
1
Statistics II: Applied Quantitative Analysis Lecture and Seminar
Notes (Week 1-6)
Table of Contents
Week 1: Bivariate Linear Regression 2
Workgroup Session #1 7
Week 2: Multiple Linear Regression 8
Workgroup Session #2 15
Week 3: Moderation, Mediation, and Outliers/Influential Cases 17
Workgroup Session #3 23
Week 4: OLS Assumptions 26
Workgroup Session #4 31
Week 5: Logistic Regression 34
Workgroup Session #5 39
Week 6: Logistic Regression Model Assumptions 41
, 2
Week 1: Bivariate Linear Regression
Statistical Models
Correlation: A measure of the strength of the variables’ linear relationship towards one another.
Models = Abstractions.
➔ 𝑑𝑎𝑡𝑎 = 𝑚𝑜𝑑𝑒𝑙 + 𝑒𝑟𝑟𝑜𝑟
➔ Statistical Model: A theory of how the observed data was generated. It is used to:
◆ Make predictions inside our data or outside with new cases.
◆ Test claims about causal inference.
● Causal Inference: Using observed relationships in our data to try and infer
whether X causes Y (“using known facts”). Deals more with the nature of
data, than the nature of the model. The problem with causal inference is that
any given observation is counterfactual (i.e. we can only observe part of the
values).
● Causality: If everything else stayed the same, what would have happened if
the potential causes took on a different value? Summarise relationships.
Types of statistical models:
1. Ordinary Least Squares (OLS): Models continuous dependent variables, with a variety of
different independent variables.
2. Logit Models: Models binary (two) outcome variables.
3. Multinomial and Ordered/Ordinal Logit Models: Models categorical (multiple categories)
and ordinal dependent variables.
Each type of model enables us to:
● Predict the value of a dependent variable using multiple independent variables in a sample of
cases
● Make inferences from that sample to a broader population (given some assumptions).
Linear Regression
Two types of variables in models:
1. Dependent Variable (DV): The variable we want to predict/explain/understand (i.e. outcome
variable, Y).
2. Independent Variable (IV): The variable we are using to predict/explain the outcome (i.e.
predictor variable, X).
➔ With multiple additional variables (control, covariates) use: 𝑋1, 𝑋2... 𝑋𝑘; 𝑍.
Models are used to describe the data more efficiently and accurately.
➔ So, NOT all data will fall on the prediction line, as a result of fundamental randomness,
omitted variables, measurement error, etc..
➔ Variables within models (e.g. 𝑏1, 𝑏2...) can be called slope term, coefficients or parameters.
➔ Subscripts reference a particular observation in the data (e.g. 𝑏1 = the 1st observation).
, 3
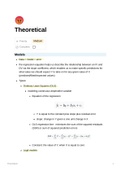
Linear Regression Analysis: The simplest model; a straight line that represents the formula. It
describes the relationship between two variables, modelling the dependent variable as a function of
two terms (i.e. a series of predictions). Here:
● 𝑎 = Constant/intercept (average value of Y, when X = 0). 𝑦 = 𝑎 + 𝑏𝑥
● 𝑏 = Slope of the line (average change of Y given a one unit
change of X).
(Sample) Regression Equation: If various assumptions hold, this equation’s results can be used to
make inferences about the population of cases. Here:
● 𝑦 = Predicted variable (to only calculate this, exclude the residual from the equation).
● 𝑏0 = Constant/intercept; average expected value of Y when X=0 in our data.
● 𝑏1 = Slope of the line; average change in Y given a one-unit change in X in our data.
● ϵ𝑖 = Residual error (epsilon).
𝑦𝑖 = 𝑏0 + 𝑏1𝑥𝑖 + ϵ𝑖
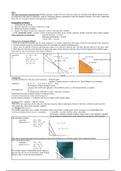
Residuals: The difference between what the model predicts and the observed value (i.e. prediction
errors). Here:
● ϵ𝑖 = Residual/prediction error (epsilon).
ϵ𝑖 = 𝑦𝑖 − 𝑦𝑖
● 𝑦𝑖 = Observed value for each observation.
● 𝑦𝑖 = Fitted/predicted value for each observation.
(Ordinary) Least Squares (OLS): The most prominent regression line that minimises the sum of
squared residuals/prediction errors (SSR).
𝑛 2
𝑆𝑆𝑅 = ∑ ϵ
𝑖=1
𝑛 2
= ∑ ⎡⎢𝑦𝑖 − 𝑦𝑖⎤⎥
𝑖=1 ⎣ ⎦
𝑛
[
= ∑ 𝑦𝑖 − 𝑏0 + 𝑏1
𝑖=1
( )]2
A line of best fit is chosen to reduce, as much as possible, the regression line’s prediction errors.
Interpreting Coefficients
Another form of the (sample) regression equation, where:
● 𝔼 = Expected value of Y when X takes a particular value.
INCLUDES Q&A lectures, web lectures and seminar notes from week 1-6 (Total: 43 pages).
1
Statistics II: Applied Quantitative Analysis Lecture and Seminar
Notes (Week 1-6)
Table of Contents
Week 1: Bivariate Linear Regression 2
Workgroup Session #1 7
Week 2: Multiple Linear Regression 8
Workgroup Session #2 15
Week 3: Moderation, Mediation, and Outliers/Influential Cases 17
Workgroup Session #3 23
Week 4: OLS Assumptions 26
Workgroup Session #4 31
Week 5: Logistic Regression 34
Workgroup Session #5 39
Week 6: Logistic Regression Model Assumptions 41
, 2
Week 1: Bivariate Linear Regression
Statistical Models
Correlation: A measure of the strength of the variables’ linear relationship towards one another.
Models = Abstractions.
➔ 𝑑𝑎𝑡𝑎 = 𝑚𝑜𝑑𝑒𝑙 + 𝑒𝑟𝑟𝑜𝑟
➔ Statistical Model: A theory of how the observed data was generated. It is used to:
◆ Make predictions inside our data or outside with new cases.
◆ Test claims about causal inference.
● Causal Inference: Using observed relationships in our data to try and infer
whether X causes Y (“using known facts”). Deals more with the nature of
data, than the nature of the model. The problem with causal inference is that
any given observation is counterfactual (i.e. we can only observe part of the
values).
● Causality: If everything else stayed the same, what would have happened if
the potential causes took on a different value? Summarise relationships.
Types of statistical models:
1. Ordinary Least Squares (OLS): Models continuous dependent variables, with a variety of
different independent variables.
2. Logit Models: Models binary (two) outcome variables.
3. Multinomial and Ordered/Ordinal Logit Models: Models categorical (multiple categories)
and ordinal dependent variables.
Each type of model enables us to:
● Predict the value of a dependent variable using multiple independent variables in a sample of
cases
● Make inferences from that sample to a broader population (given some assumptions).
Linear Regression
Two types of variables in models:
1. Dependent Variable (DV): The variable we want to predict/explain/understand (i.e. outcome
variable, Y).
2. Independent Variable (IV): The variable we are using to predict/explain the outcome (i.e.
predictor variable, X).
➔ With multiple additional variables (control, covariates) use: 𝑋1, 𝑋2... 𝑋𝑘; 𝑍.
Models are used to describe the data more efficiently and accurately.
➔ So, NOT all data will fall on the prediction line, as a result of fundamental randomness,
omitted variables, measurement error, etc..
➔ Variables within models (e.g. 𝑏1, 𝑏2...) can be called slope term, coefficients or parameters.
➔ Subscripts reference a particular observation in the data (e.g. 𝑏1 = the 1st observation).
, 3
Linear Regression Analysis: The simplest model; a straight line that represents the formula. It
describes the relationship between two variables, modelling the dependent variable as a function of
two terms (i.e. a series of predictions). Here:
● 𝑎 = Constant/intercept (average value of Y, when X = 0). 𝑦 = 𝑎 + 𝑏𝑥
● 𝑏 = Slope of the line (average change of Y given a one unit
change of X).
(Sample) Regression Equation: If various assumptions hold, this equation’s results can be used to
make inferences about the population of cases. Here:
● 𝑦 = Predicted variable (to only calculate this, exclude the residual from the equation).
● 𝑏0 = Constant/intercept; average expected value of Y when X=0 in our data.
● 𝑏1 = Slope of the line; average change in Y given a one-unit change in X in our data.
● ϵ𝑖 = Residual error (epsilon).
𝑦𝑖 = 𝑏0 + 𝑏1𝑥𝑖 + ϵ𝑖
Residuals: The difference between what the model predicts and the observed value (i.e. prediction
errors). Here:
● ϵ𝑖 = Residual/prediction error (epsilon).
ϵ𝑖 = 𝑦𝑖 − 𝑦𝑖
● 𝑦𝑖 = Observed value for each observation.
● 𝑦𝑖 = Fitted/predicted value for each observation.
(Ordinary) Least Squares (OLS): The most prominent regression line that minimises the sum of
squared residuals/prediction errors (SSR).
𝑛 2
𝑆𝑆𝑅 = ∑ ϵ
𝑖=1
𝑛 2
= ∑ ⎡⎢𝑦𝑖 − 𝑦𝑖⎤⎥
𝑖=1 ⎣ ⎦
𝑛
[
= ∑ 𝑦𝑖 − 𝑏0 + 𝑏1
𝑖=1
( )]2
A line of best fit is chosen to reduce, as much as possible, the regression line’s prediction errors.
Interpreting Coefficients
Another form of the (sample) regression equation, where:
● 𝔼 = Expected value of Y when X takes a particular value.