Psychology 253 Chapter 1
Chapter 1: Introduction to Statistics
Statistics – consists of facts and figures / a general field of mathemagicks.
- Refers to a set of mathemagical procedures for organizing, summarizing, and
interpreting information.
Stats serve two general purposes:
1) They are used to organize and summarize the information = communication of results.
2) Assist the researcher to answer the questions that initiated the research.
Population: the set of all the individuals of interest in a particular study.
Sample: a set of individuals selected from a population, usually intended to represent the
population in a research study.
Variable: something that can change or have different values.
Datum: the measurement obtained for each individual.
- Also called: a score or raw score.
Data Set: the complete set of scores.
Data (plural) are measurements or observations. A data set is a collection of measurements
or observations. A datum (singular) is a single measurement or observation and is commonly
called a score or raw score.
A Parameter: a value – usually a numerical value – that describes a population.
- Usually derived from measurements of the individuals in the population.
A Statistic: a value – usually a numerical value – that describes a sample.
- Usually derived from measurements of the individuals in the sample.
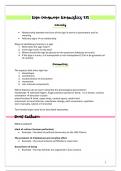
Descriptive and Inferential Statistical Methods:
Descriptive Stats: are statistical procedures used to summarize, organize, and simplify data.
- Techniques that take raw scores and organize/summarize them in a form that is more
manageable.
- Scores are organized in a table or a graph. So it is possible to see the entire set of
scores.
- Also uses computation of the average.
Inferential Stats: consists of techniques that allow us to study samples and then make
generalizations about the populations from which they were selected.
1
,Psychology 253 Chapter 1
Sampling Error: the naturally occurring discrepancy, or error, that exists between a sample
statistic and the corresponding population parameter.
- One issue with samples is that they provide limited information about the population
= a discrepancy between a sample statistic and the corresponding population
parameter.
- “margin of error”
VARIABLES AND MEASUREMENTS
Constructs and Operational Definitions:
Variables like intelligence, anxiety, and hunger are called constructs, and because they are
intangible and cannot be directly observed, they are called hypothetical constructs.
Operational Definition: defines a construct in terms of external behaviors that can be
observed and measured.
- Intelligence can be measured through performance on an IQ test.
- Identifies a measurement procedure (a set of operations) for measuring an external
behavior and uses the resulting measurements as a definition and a measurement of
a hypothetical construct.
- An operational definition has two components:
o First, it describes a set of operations for measuring a construct.
o Second, it defines the contrast in terms of the resulting measurements.
Constructs: internal attributes or characteristics that cannot be directly observed but are
useful for describing and explaining behavior.
Discrete and Continuous Variables:
Discrete Variable: consists of separate, indivisible categories.
- No values can exist between two neighboring categories.
- Commonly restricted to whole, countable numbers.
- Can also consist of qualitative observations (occupation; academic major etc.).
Continuous Variable: an infinite number of possible values that fall between any two observed
values.
- Is divisible into an infinite number of fractional parts.
- Time; height; weight etc.
- Two Other Factors Apply to Continuous Variables:
o When measuring a continuous variable, it should be very rare to obtain
identical measurements for two different individuals.
o Researchers must first identify a series of measurement categories on the scale
of measurement.
2
,Psychology 253 Chapter 1
1) Each measurement category is actually an interval that must be defined
by boundaries.
- Real Limits: are the boundaries of intervals for scores that are represented on a
continuous number line.
o The real limit separating two adjacent scores is located exactly halfway
between the scores.
o Each score has two real limits.
1) The upper real limit is at the top of the interval and the lower real limit
is at the bottom.
Scales of Measurement:
Measurement involves assigning individuals or events into categories.
Scale of Measurement: the categories used to measure a variable and the relationships
between the categories determine different types of scales.
- Distinctions among the scales are important because they identify the limitations of
certain types of measurements.
The Nominal Scale: consists of a set of categories that have different names. Measurements
on a nominal scale label and categorize observations, but do not make any quantitative
distinctions between observations.
- “Nominal” means ‘having to do with names’.
- Involves classifying individuals into categories that have different names but are not
related to each other in any systematic way.
o Academic majors: art, bio, business etc.
o Race, gender, occupation etc.
- The measurements from a nominal scale allow us to determine whether two
individuals are different, but they do not identify either the direction or the size of the
differences.
The Ordinal Scale: consists of a set of categories that are organized in an ordered sequence.
- Rank observations in terms of size or magnitude.
- Organized in a fixed order corresponding to differences of magnitude.
- Consists of a series of rank (1st, 2nd, 3rd etc.).
- S, M, L.
o The categories form an ordered sequence = there is a directional relationship.
- Determine whether two individuals are difference and you can determine the
direction of difference.
- Ordinal measurements do not allow you to determine the size of the difference
between two individuals.
3
, Psychology 253 Chapter 1
The Interval and Ratio Scales:
- Both consist of a series of ordered categories (like an ordinal scale) BUT with the
additional requirement that the categories form a series of intervals that are all exactly
the same size.
o This allows one to determine both the direction and the size of the difference
between the two measurements.
- What differentiates the two is the nature of the zero point.
o An interval scale has an arbitrary zero point – the value of 0 is assigned to a
particular location on the scale as a matter of convenience/reference.
o A ratio scale is anchored by a zero point that is not arbitrary but rather a
meaningful value representing none (a complete absence) of the variable being
measured.
- Interval Scale: consists of ordered categories that are all intervals of exactly the same
size.
o Equal differences between numbers on scale reflect equal differences in
magnitude.
o However, the zero point on an interval scale is arbitrary and does not indicate
a zero amount of the variable being measured.
- Ratio Scale: an interval with the additional feature that a score of zero indicates none
of the variable being measured.
o Ratios of numbers do reflect ratios of magnitude.
Data Structure 1: One Group with One or More Separate Variables Measured for Each
Individual – DESCRIPTIVE Research
- Some research studies are conducted simply to describe individual variables as they
exist naturally.
o Although the research might measure several different variables, the goal of
the study is to describe each variable separately.
o Not concerned with relationships between variables.
- Descriptive Research/ Descriptive Research Strategy: involves measuring one or more
separate variables for each individual with the intent of simply describing the
individual variables.
Data Structure 2: One Group with Two Variables Measured for Each Individual – The
CORRELATIONAL Method
- Examining the relationship between variables – observe the two variables as they exist
naturally for a set of individuals.
- Scatter plots.
- Correlational Method: two different variables are observed to determine whether
there is a relationship between them.
o A research study that measures x2 different variables for each individual.
o Chi-square test – non-numerical data.
4
Chapter 1: Introduction to Statistics
Statistics – consists of facts and figures / a general field of mathemagicks.
- Refers to a set of mathemagical procedures for organizing, summarizing, and
interpreting information.
Stats serve two general purposes:
1) They are used to organize and summarize the information = communication of results.
2) Assist the researcher to answer the questions that initiated the research.
Population: the set of all the individuals of interest in a particular study.
Sample: a set of individuals selected from a population, usually intended to represent the
population in a research study.
Variable: something that can change or have different values.
Datum: the measurement obtained for each individual.
- Also called: a score or raw score.
Data Set: the complete set of scores.
Data (plural) are measurements or observations. A data set is a collection of measurements
or observations. A datum (singular) is a single measurement or observation and is commonly
called a score or raw score.
A Parameter: a value – usually a numerical value – that describes a population.
- Usually derived from measurements of the individuals in the population.
A Statistic: a value – usually a numerical value – that describes a sample.
- Usually derived from measurements of the individuals in the sample.
Descriptive and Inferential Statistical Methods:
Descriptive Stats: are statistical procedures used to summarize, organize, and simplify data.
- Techniques that take raw scores and organize/summarize them in a form that is more
manageable.
- Scores are organized in a table or a graph. So it is possible to see the entire set of
scores.
- Also uses computation of the average.
Inferential Stats: consists of techniques that allow us to study samples and then make
generalizations about the populations from which they were selected.
1
,Psychology 253 Chapter 1
Sampling Error: the naturally occurring discrepancy, or error, that exists between a sample
statistic and the corresponding population parameter.
- One issue with samples is that they provide limited information about the population
= a discrepancy between a sample statistic and the corresponding population
parameter.
- “margin of error”
VARIABLES AND MEASUREMENTS
Constructs and Operational Definitions:
Variables like intelligence, anxiety, and hunger are called constructs, and because they are
intangible and cannot be directly observed, they are called hypothetical constructs.
Operational Definition: defines a construct in terms of external behaviors that can be
observed and measured.
- Intelligence can be measured through performance on an IQ test.
- Identifies a measurement procedure (a set of operations) for measuring an external
behavior and uses the resulting measurements as a definition and a measurement of
a hypothetical construct.
- An operational definition has two components:
o First, it describes a set of operations for measuring a construct.
o Second, it defines the contrast in terms of the resulting measurements.
Constructs: internal attributes or characteristics that cannot be directly observed but are
useful for describing and explaining behavior.
Discrete and Continuous Variables:
Discrete Variable: consists of separate, indivisible categories.
- No values can exist between two neighboring categories.
- Commonly restricted to whole, countable numbers.
- Can also consist of qualitative observations (occupation; academic major etc.).
Continuous Variable: an infinite number of possible values that fall between any two observed
values.
- Is divisible into an infinite number of fractional parts.
- Time; height; weight etc.
- Two Other Factors Apply to Continuous Variables:
o When measuring a continuous variable, it should be very rare to obtain
identical measurements for two different individuals.
o Researchers must first identify a series of measurement categories on the scale
of measurement.
2
,Psychology 253 Chapter 1
1) Each measurement category is actually an interval that must be defined
by boundaries.
- Real Limits: are the boundaries of intervals for scores that are represented on a
continuous number line.
o The real limit separating two adjacent scores is located exactly halfway
between the scores.
o Each score has two real limits.
1) The upper real limit is at the top of the interval and the lower real limit
is at the bottom.
Scales of Measurement:
Measurement involves assigning individuals or events into categories.
Scale of Measurement: the categories used to measure a variable and the relationships
between the categories determine different types of scales.
- Distinctions among the scales are important because they identify the limitations of
certain types of measurements.
The Nominal Scale: consists of a set of categories that have different names. Measurements
on a nominal scale label and categorize observations, but do not make any quantitative
distinctions between observations.
- “Nominal” means ‘having to do with names’.
- Involves classifying individuals into categories that have different names but are not
related to each other in any systematic way.
o Academic majors: art, bio, business etc.
o Race, gender, occupation etc.
- The measurements from a nominal scale allow us to determine whether two
individuals are different, but they do not identify either the direction or the size of the
differences.
The Ordinal Scale: consists of a set of categories that are organized in an ordered sequence.
- Rank observations in terms of size or magnitude.
- Organized in a fixed order corresponding to differences of magnitude.
- Consists of a series of rank (1st, 2nd, 3rd etc.).
- S, M, L.
o The categories form an ordered sequence = there is a directional relationship.
- Determine whether two individuals are difference and you can determine the
direction of difference.
- Ordinal measurements do not allow you to determine the size of the difference
between two individuals.
3
, Psychology 253 Chapter 1
The Interval and Ratio Scales:
- Both consist of a series of ordered categories (like an ordinal scale) BUT with the
additional requirement that the categories form a series of intervals that are all exactly
the same size.
o This allows one to determine both the direction and the size of the difference
between the two measurements.
- What differentiates the two is the nature of the zero point.
o An interval scale has an arbitrary zero point – the value of 0 is assigned to a
particular location on the scale as a matter of convenience/reference.
o A ratio scale is anchored by a zero point that is not arbitrary but rather a
meaningful value representing none (a complete absence) of the variable being
measured.
- Interval Scale: consists of ordered categories that are all intervals of exactly the same
size.
o Equal differences between numbers on scale reflect equal differences in
magnitude.
o However, the zero point on an interval scale is arbitrary and does not indicate
a zero amount of the variable being measured.
- Ratio Scale: an interval with the additional feature that a score of zero indicates none
of the variable being measured.
o Ratios of numbers do reflect ratios of magnitude.
Data Structure 1: One Group with One or More Separate Variables Measured for Each
Individual – DESCRIPTIVE Research
- Some research studies are conducted simply to describe individual variables as they
exist naturally.
o Although the research might measure several different variables, the goal of
the study is to describe each variable separately.
o Not concerned with relationships between variables.
- Descriptive Research/ Descriptive Research Strategy: involves measuring one or more
separate variables for each individual with the intent of simply describing the
individual variables.
Data Structure 2: One Group with Two Variables Measured for Each Individual – The
CORRELATIONAL Method
- Examining the relationship between variables – observe the two variables as they exist
naturally for a set of individuals.
- Scatter plots.
- Correlational Method: two different variables are observed to determine whether
there is a relationship between them.
o A research study that measures x2 different variables for each individual.
o Chi-square test – non-numerical data.
4