Unit 11 assignment 4
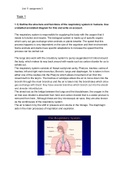
Task 1
1.1
1.2
1.3
1.4
Task 2
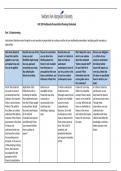
Lung function tests were carried out on members of the class and results were recorded. Means
were calculated also. The table represents the comparison of means for males and females
from my results and means for males and females from published normal figures.
Height Peak flow (litres/min) Height Peak flow (litres/min)
150 cm 400
157cm 425
163 cm 500
169cm 420
172cm 450
173cm 450
178cm 575
Task 1
1.1
1.2
1.3
1.4
Task 2
Lung function tests were carried out on members of the class and results were recorded. Means
were calculated also. The table represents the comparison of means for males and females
from my results and means for males and females from published normal figures.
Height Peak flow (litres/min) Height Peak flow (litres/min)
150 cm 400
157cm 425
163 cm 500
169cm 420
172cm 450
173cm 450
178cm 575